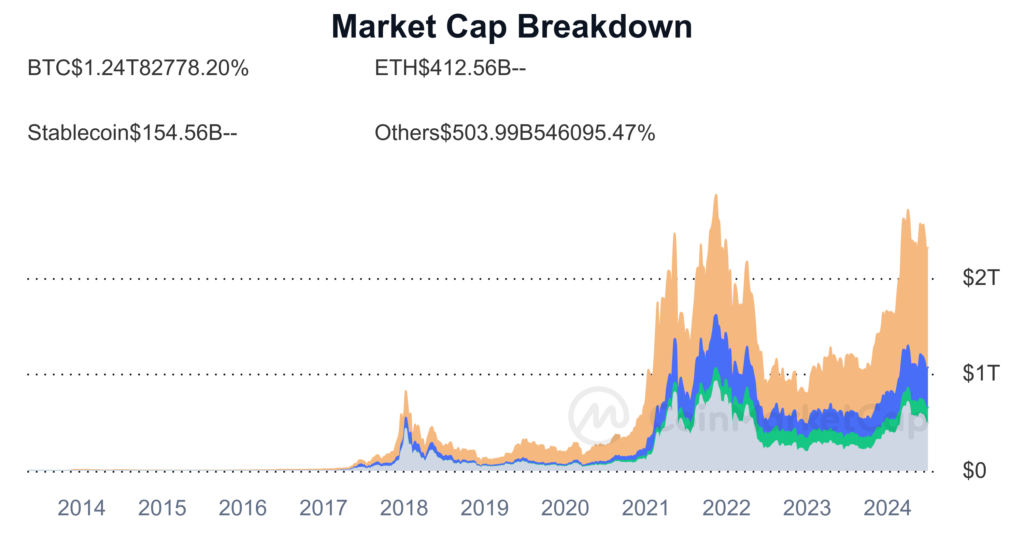
The first half of 2024 saw a significant contraction in the global crypto market cap, which stands at $2.3 trillion, marking a 14.5% decrease in Q2.
Conversely, the 24-hour trade volume experienced a substantial increase, rising by 223% to $79.4 billion in Q2, indicating heightened trading activity amid the market’s downward trend.
Market Sentiment and Bitcoin Dominance
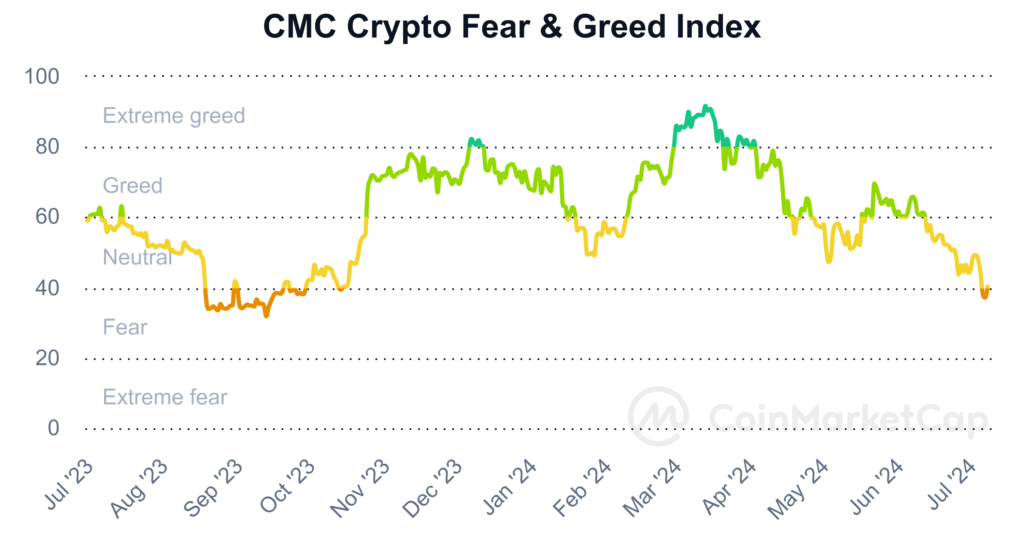
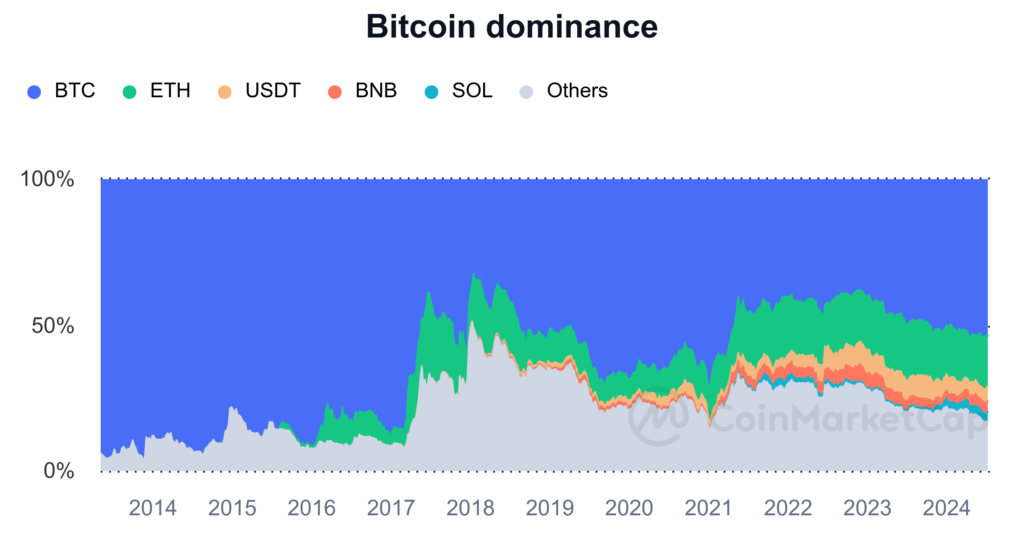
The CoinMarketCap (CMC) Crypto Fear and Greed Index is currently in the 40s range, signaling a neutral market sentiment. However, sentiment has been leaning towards fear since Q1, fluctuating between a high of 69 and a low of 47 in May. Bitcoin continues to dominate with a 53% market share, showing no signs of an altcoin season. Liquidity has decreased by 18.5% in the past month, mirroring the bearish trends reminiscent of September 2023. Despite bullish macroeconomic drivers like the anticipated approval of Ethereum ETFs and potential US interest rate cuts, the market exhibits characteristics of a “bear phase” within an overall bull market trend.
Is History Repeating Itself?
Yes, Repeating
Bitcoin Dominance (BTC.D): Historically, in early bull runs, Bitcoin leads the market. BTC.D has increased from 38.4% in November 2022 to 54% in the current cycle.
Stablecoin Supply: A 19.8% increase in stablecoin supply since the start of 2024 suggests a capital influx into the crypto markets, indicating a bull market onset.
BTC Supply on Exchanges: A decrease in BTC’s supply on exchanges, as seen in the 2021 bull cycle, reflects long-term storage trends.
No, Not Repeating
Bull Cycle Drawdown: The current bull cycle’s max drawdown is 18%, significantly less severe than previous cycles, attributed to Bitcoin’s maturation and ETF flows.
All-Time High (ATH) Pre-Halving: BTC reached an ATH of $73,000 before the halving, an unprecedented move driven by institutional inflows from spot BTC ETFs.
Market Trends and Sector Performance
Institutional and Retail Dynamics
The bull market thus far has been driven by crypto natives and institutional investors, with $17.1 billion in total institutional inflows, predominantly in Bitcoin ($16.7 billion). Retail metrics, such as Google search trends and new crypto YouTube subscribers, indicate a lag in retail investor participation.
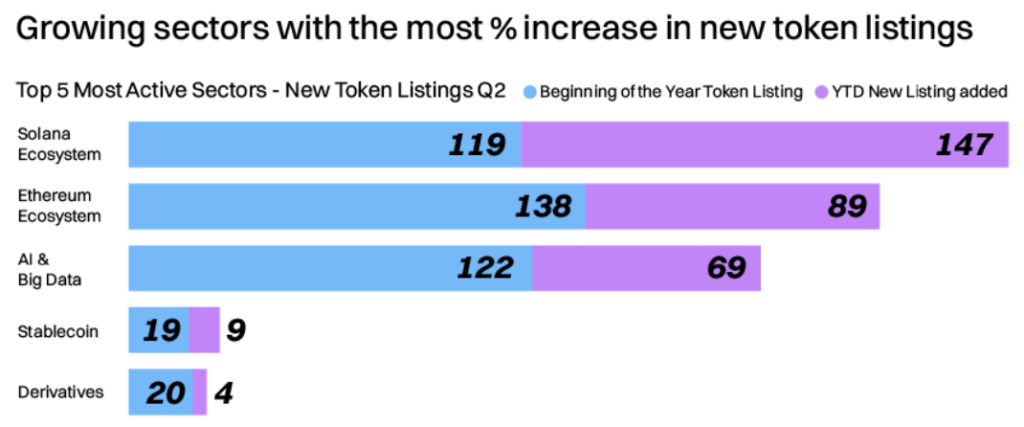
While 89% of sectors experienced a negative market cap change, three sectors saw positive growth in Q2:
Stablecoins (+8.6%)
AI and Big Data (+2.5%)
The Stablecoin sector’s growth was bolstered by projects like Ethena and Lista. Notably, Tether’s $4.52 billion profit in Q1 2024 highlights the sector’s profitability.
Market Sentiment – Unwrapping CMC’s Unique Data
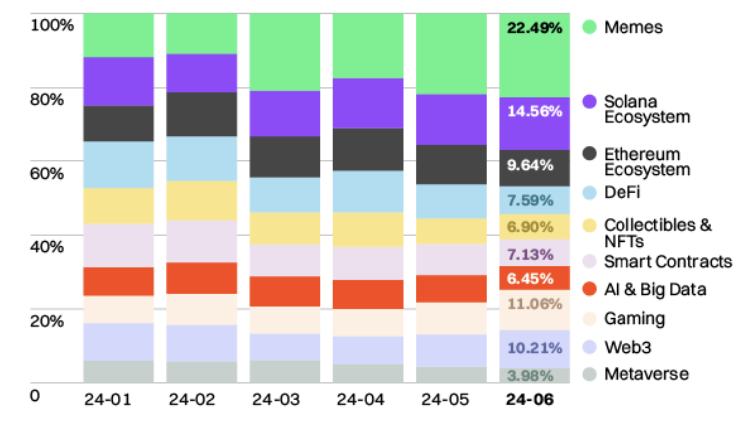
Most Popular CMC Categories
Meme Coins: For the first time, Meme Coins became the most popular category, accounting for 23% of page views on CMC.
Solana’s Popularity: Solana’s ecosystem has gained more attention than Ethereum’s, signaling its growing prominence despite not yet dethroning Ethereum.
Top Coins per Category
Solana (SOL): Meme coins dominate, indicating a speculative rush.
Ethereum Ecosystem: Focuses on Real World Assets (RWA) and AI distributed computing, emphasizing practical blockchain applications.
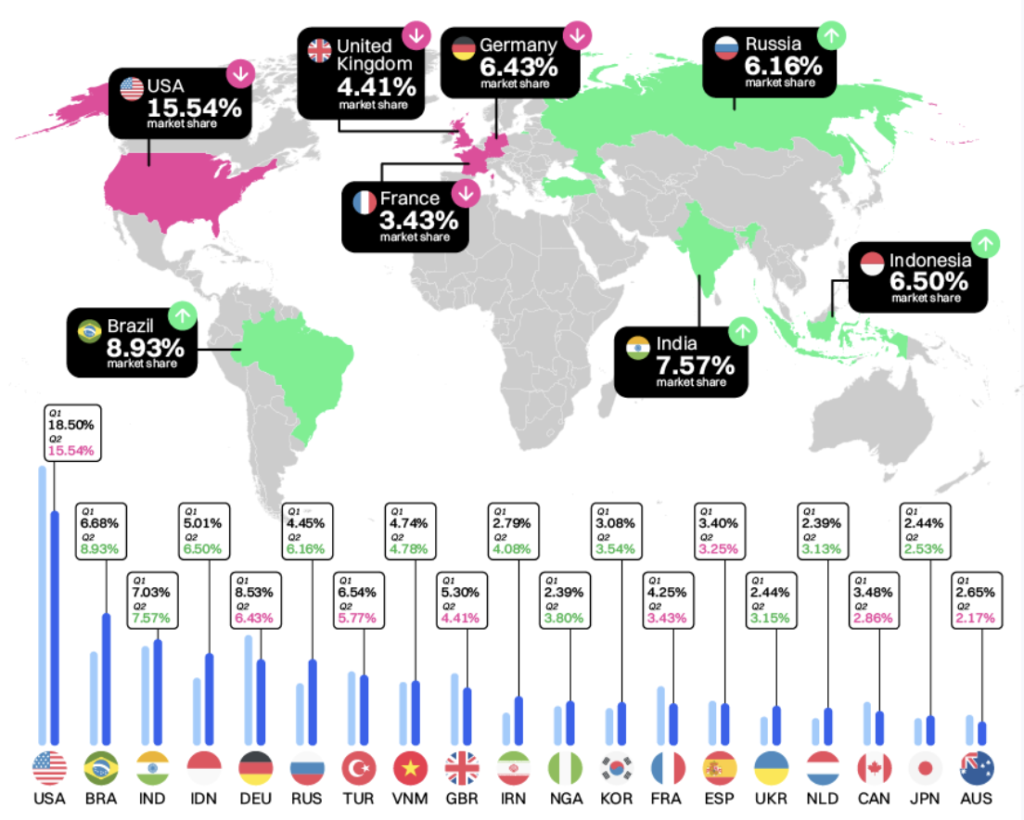
Regional User Trends
Countries like Brazil, India, and Indonesia have shown increased crypto activity, driven by the meme-centric market environment. Traditional crypto strongholds like the USA and UK have seen a decline in market share.
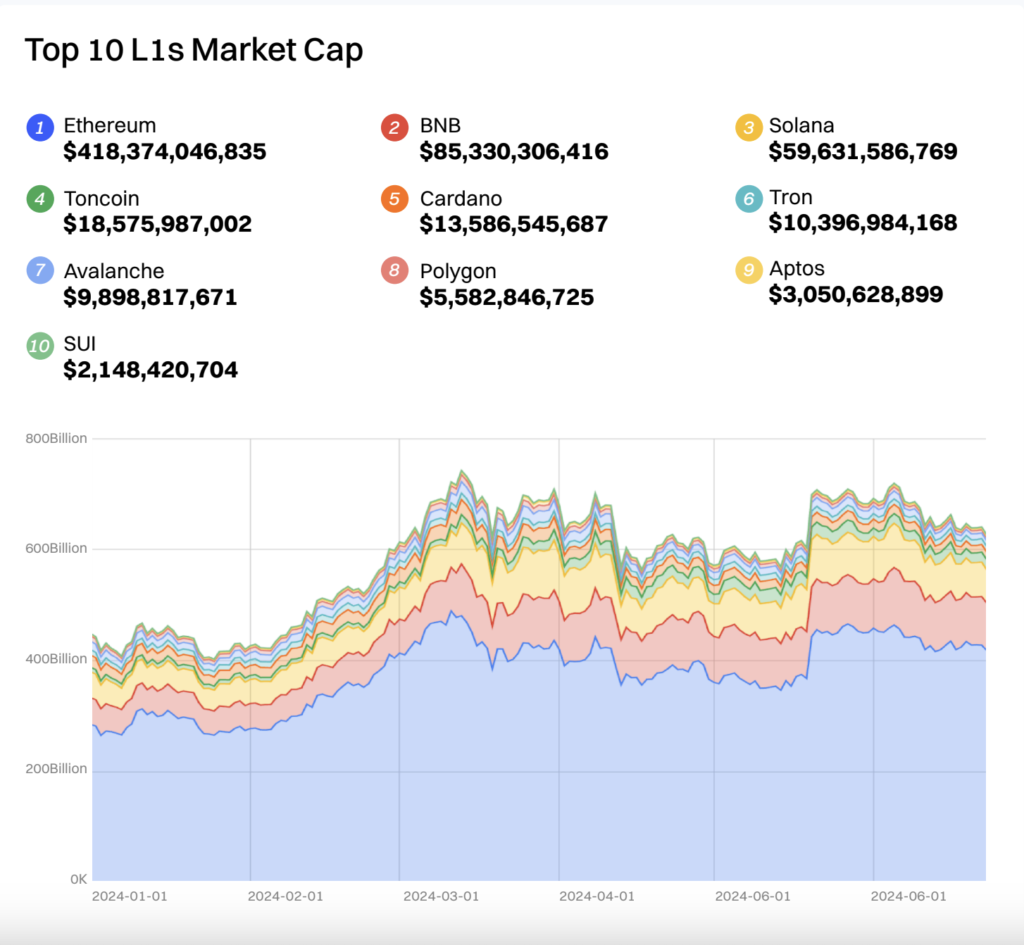
Network Activities: Solana leads with 1.6 million active daily addresses.
Transaction Revenue: Ethereum generates $2.7 million in daily revenue, followed by Solana’s $900k.
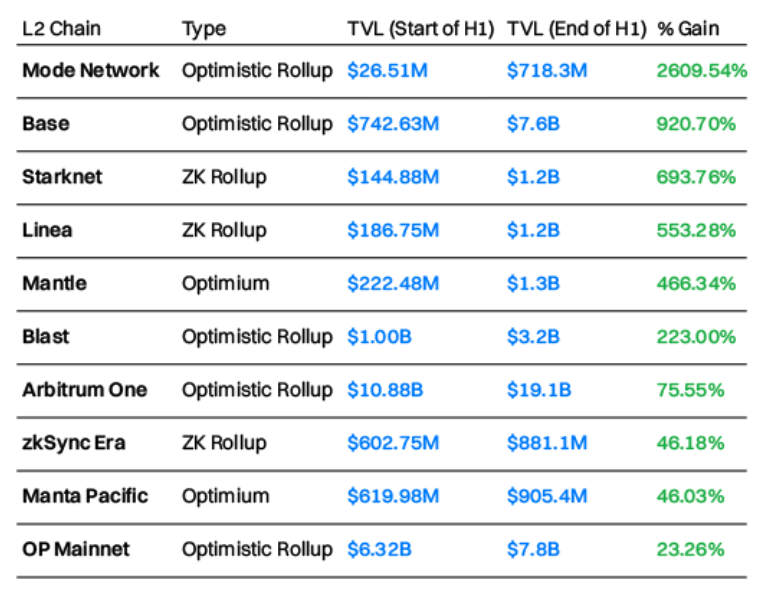
Layer-2s
Arbitrum and Base: Lead in TVL gains with $8.2 billion and $6.8 billion respectively.
Base Network: Surpassed Arbitrum in user activity due to Coinbase’s smart wallet launch.
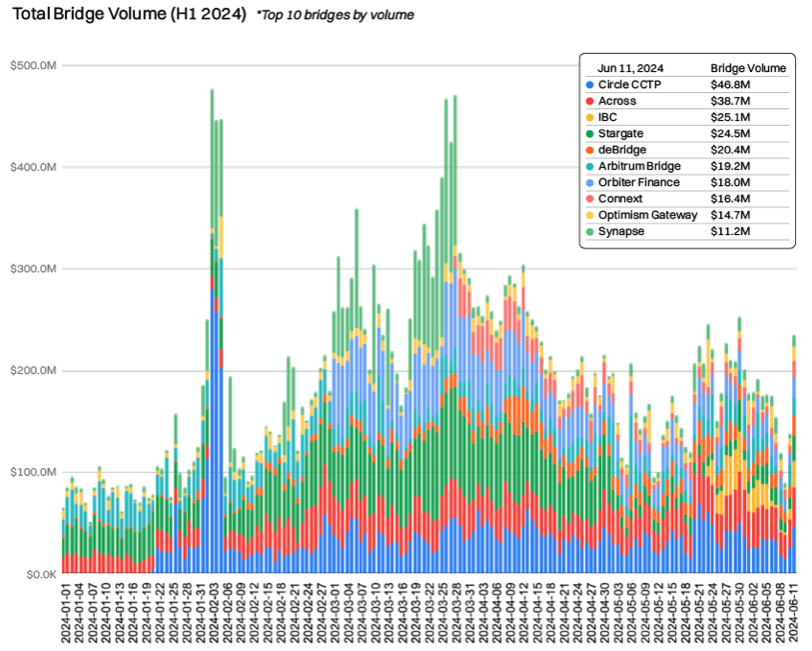
Cross-Chain Bridges
Circle’s CCTP leads with 15.6% market share, indicating a diverse and competitive landscape.
CMC Listing/Research Insight
Politics & Policies
The crypto industry has increased its political influence, with significant spending planned for the 2024 elections. Bipartisan support for crypto-friendly legislation and a changing stance from the Biden administration signal growing political engagement.
ETFs
Over 1 million Bitcoin are now held in ETFs, attracting $28 billion in additional inflows. Ethereum ETFs, approved in May 2024, have also seen significant interest, reflecting the growing institutional adoption of crypto assets.
Conclusion
The first half of 2024 has been a dynamic period for the crypto market, characterized by significant institutional inflows, evolving market sentiment, and the rise of new sectors like stablecoins and AI. Despite bearish trends, the market shows signs of resilience and ongoing innovation, laying the groundwork for future growth and adoption.