The Denominator Illusion: Why the AI Bubble Debate May Be Measuring the Wrong Thing
Macro Forensics | Monetary Debasement | July 2026
The Denominator Illusion: Forensic Evidence That the "AI Bubble" Is Partly a Measurement Error, and Why Crypto May Be the Most Mispriced Asset Class in Dollar Terms
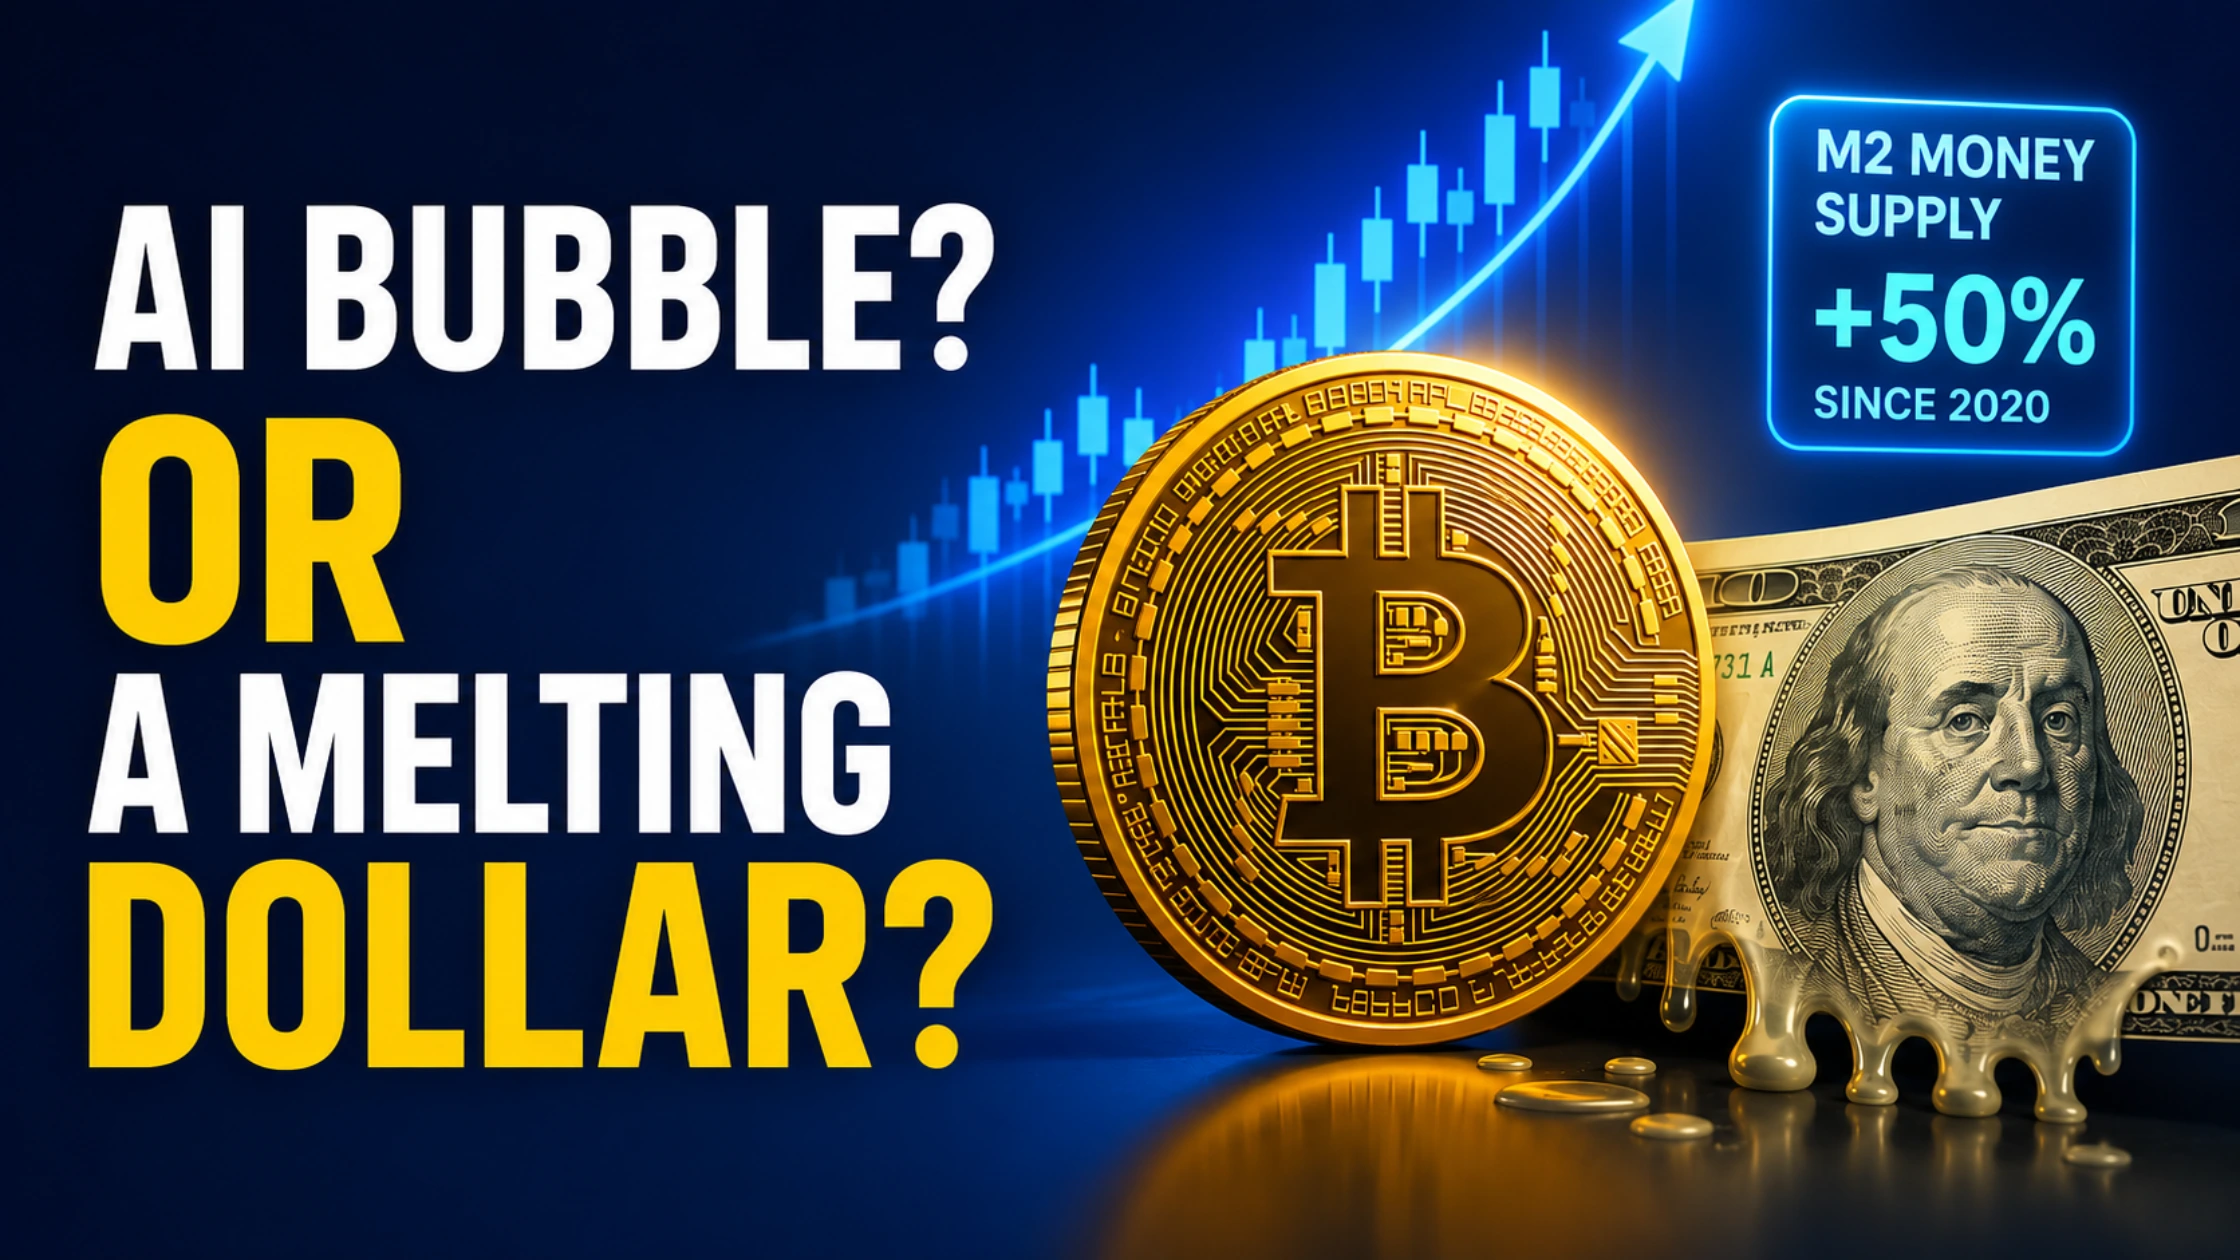
The consensus "AI bubble" debate measures asset prices against a yardstick, the US dollar, that is itself shrinking, and this article quantifies by how much. US M2 hit a record $23.05 trillion in May 2026, the Federal Reserve has cut rates 175 basis points since 2025 and resumed quantitative easing via $40 billion in monthly Treasury purchases, federal interest expense exceeds $1.1 trillion annually (more than defense spending), deficits run near 6 to 7% of GDP at full employment, and dollar-denominated global M2 stands at roughly $101.7 trillion. The DN True Debasement Rate, a proprietary composite of seven monetary metrics introduced here, estimates true annual dollar dilution at approximately 8.6%, versus the 3.3% official CPI print. Repriced against that denominator, the picture inverts: the Nasdaq 100, at a trailing P/E near 33 versus roughly 104 at the 1999 dot-com peak, is up only about 12% in gold terms since January 2020 and is down roughly 26% in gold terms from its November 2021 peak, while the S&P 500 in gold terms is negative since January 2020. Crypto is the outlier in the other direction: Bitcoin near $59,000 in early July 2026 is down roughly 53% from its October 2025 all-time high of $126,272 and trades at its lowest level in 21 months, total crypto market capitalisation of about $2.21 trillion has fallen from roughly 14% of US M2 at the November 2021 peak to under 10% today, and Bitcoin's share of global M2 has more than halved from about 2.5% at the ATH to roughly 1.2%. The article maps every major debasement metric plus factors rarely accounted for (stablecoin shadow-dollar issuance, the interest-expense compounding loop, activist Treasury issuance), and ships the DN Denominator Terminal: a three-mode instrument computing the True Debasement Rate, repricing major assets in M2 and gold terms, and projecting 2030 asset levels under explicit money-growth scenarios.
Every argument about whether the Nasdaq 100 is in an AI bubble shares one unexamined assumption: that the dollar it is priced in has held still. It has not. Since January 2020, the US M2 money supply has expanded roughly 50%, from $15.4 trillion to a record $23.05 trillion as of May 2026, and the market's own hardest measure of monetary confidence, gold, has repriced from about $1,550 to roughly $4,050 per ounce even after suffering its worst quarterly decline since 2013. This article does what almost no bubble coverage does: it forensically measures the denominator first, builds a composite instrument to quantify true dollar dilution, and only then asks whether equities are expensive, and whether crypto, after one of the most brutal drawdowns in its history, is now severely underpriced against monetary reality.
Bubbles are not defined by an absence of fundamentals. As Resonanz Capital's January 2026 allocator analysis put it, they are defined by price becoming dependent on "narrative, positioning, and marginal liquidity." The uncomfortable corollary this article explores: marginal liquidity is now permanent policy, which changes what a fair price even means.
— Framing per Resonanz Capital, "Has the AI Boom Caused a Bubble in U.S. Stock Markets?", January 2026.The Wrong Question: What the June 2026 Selloff Actually Revealed
The bubble debate reached maximum volume in late June 2026, when a Korean chip-led rout forced KOSPI trading halts, sent Samsung and SK Hynix down 12% in a morning, dragged the Nasdaq down 2.2% in a session, and handed Oracle its worst week since the dot-com era. Yet the valuation evidence keeps refusing to cooperate with the 1999 analogy. The Nasdaq 100's trailing P/E sits near 33 as of early July 2026; at the end of 1999 the imputed index P/E was roughly 104, and it likely reached 150 to 200 at the very peak. In 1999, more than three quarters of the index by market cap either traded above a 60 P/E or was unprofitable; today 99.9% of index exposure is profitable and the largest valuation bucket, nearly 60% of index market cap, trades between 20 and 40 times earnings. Hyperscaler capex, roughly half a trillion dollars in 2026, is being funded overwhelmingly from operating cash flow: the Russell 3000's capex-to-free-cash-flow ratio sits below 1, versus nearly 4 at the 2000 peak.
So the market is not 1999. But it is also not cheap: the S&P 500's Shiller P/E entered 2026 above 40, its second-richest reading since 1871, and single names like Palantir carry price-to-sales ratios that have historically never been sustained. Both camps hold real evidence, and both camps are measuring in a unit that lost a double-digit fraction of its supply-adjusted scarcity over the exact window being argued about. Before deciding whether the numerator is irrational, forensic honesty requires measuring the denominator.
The Denominator: A Forensic Inventory of Dollar Dilution, 2020 to 2026
Here is the monetary record as it stands in July 2026, item by item. US M2 reached a record $23.05 trillion in May 2026, up about 4.7% year over year and roughly 50% above its January 2020 level. The Federal Reserve has cut its policy rate by 175 basis points since 2025 to a 3.50 to 3.75% range and has returned to quantitative easing through $40 billion in monthly Treasury purchases, this while March 2026 CPI printed 3.3%, the hottest reading since May 2024, driven partly by the Hormuz oil shock. The Rothbard-Salerno "true money supply" measure crossed $20.4 trillion, with nearly 30% of all existing dollars by that measure created since January 2020. Federal debt has pushed past $37 trillion and continues climbing at a pace measured in trillions per year; annualised interest expense exceeds $1.1 trillion, now larger than the defense budget, and deficits are running at roughly 6 to 7% of GDP at full employment, a configuration with no peacetime precedent. Moody's stripped the last triple-A rating in May 2025. Zoom out further: dollar-denominated global M2 across the US, Eurozone, China, and Japan stands near $101.7 trillion, and global sectoral debt reached $340 trillion with a record 30% of it governmental.
| Debasement Metric | Reading (Mid-2026) | What It Measures |
|---|---|---|
| Official CPI (y/y) | 3.3% | Consumer basket inflation; excludes asset prices entirely |
| US M2 growth (y/y) | ~4.7% | Broad dollar supply; record $23.05T in May 2026 |
| Fed balance sheet trajectory | ~$480B/yr QE | $40B/month Treasury purchases alongside 175bps of cuts |
| Fiscal deficit (% GDP) | ~6–7% | Future monetisation pipeline at full employment |
| Global M2 (USD-denominated) | ~$101.7T | The true liquidity pool that prices global assets |
| Gold-implied debasement (5yr CAGR) | ~17.9% | The market's own vote: $1,780 (2021) to ~$4,050 (2026) |
| Stablecoin supply growth | ~$308B outstanding | Shadow-dollar issuance; 13.9% of total crypto market cap |
The Metrics Everyone Uses, and Three Nobody Prices In
Standard debasement analysis stops at CPI and M2, and both understate the problem in specific, documentable ways. CPI measures a consumer basket, so it structurally excludes the assets, equities, housing, gold, Bitcoin, that absorb new money first; this is why 3.3% CPI can coexist with gold nearly tripling in five years. M2 measures deposit-form dollars but misses the credit and collateral channels through which most purchasing power is actually created. Three factors are almost never included in the calculation, and each pushes the true rate higher.
Factor one: the interest-expense compounding loop
When annual interest expense exceeds $1.1 trillion and is financed by new issuance rather than surplus, debt service itself becomes a money-creation engine: the government borrows to pay interest on money it borrowed, and the Fed's $40 billion monthly purchases absorb a growing share of that issuance. This is a feedback loop with positive convexity, the debasement rate compounds on itself, and it is the specific mechanism behind the "fiscal dominance" thesis: the observed willingness to cut 175 basis points and restart QE while CPI runs a full point above target is most parsimoniously explained by the Treasury's refinancing bill, not the inflation mandate.
Factor two: activist Treasury issuance as stealth easing
By skewing issuance toward short-dated bills, the Treasury can suppress long-end supply and term premium, delivering duration relief that functions economically like QE without appearing on the Fed's balance sheet. The 2026 twist: with tariff revenue authority curtailed by the Supreme Court, more long-end issuance is coming, which pressures the Fed toward deeper accommodation to hold financial conditions together. Either resolution, more bills or more QE, is denominator expansion.
Factor three: stablecoins as shadow M2
Roughly $308 billion in dollar stablecoins now circulate, functionally offshore dollar deposits created outside the banking perimeter, backed largely by the same T-bills the Treasury needs sold. Stablecoin growth simultaneously expands effective dollar supply and creates structural bid for government paper, a privatised, exportable arm of dollar issuance that no traditional monetary aggregate captures. It is the single most under-modelled channel in mainstream debasement analysis, and, notably for this publication's readers, it is crypto-native infrastructure doing the work.
Repricing the "Bubble": The Numbers That Break the Consensus Frame
Now run the correction. Since January 2020, the Nasdaq 100 has returned roughly 193% in nominal dollars, the number the bubble debate is fought over. Deflate by M2 growth and it falls to roughly 96%. Price it in gold, the oldest denominator that no central bank can print, and the entire six-and-a-half-year "bubble" compresses to a total gain of about 12%, under 2% annualised. Measured from the November 2021 peak, the inversion is total: the Nasdaq 100 is up about 62% nominally but down roughly 26% priced in gold, and the S&P 500 is down roughly 33% in gold terms from that peak, and is actually negative in gold terms since January 2020. The most heavily debated "bubble" in modern markets has, against the market's own monetary yardstick, underperformed a lump of inert metal for half a decade. That does not prove equities are cheap; it proves the consensus frame is measuring the wrong variable. Much of what is being read as AI mania is, forensically, the repricing of everything against a dollar that is being diluted at a high single-digit true annual rate.
The Crypto Anomaly: The Only Major Asset Class That Ignored the Denominator
If debasement lifts all dollar-priced boats, crypto is the boat that sank anyway, and that divergence is the most analytically interesting fact in markets right now. Bitcoin opened July 2026 near $58,000, its lowest level in 652 days, down roughly 53% from its October 6, 2025 all-time high of $126,272 after a 20% June alone, capped by the largest monthly spot-ETF outflow since launch at about $4.51 billion. Total crypto market capitalisation sits near $2.21 trillion, down about 37% year over year. The altcoin complex has fared far worse across the full cycle: memecoin capitalisation collapsed from roughly $150.6 billion in December 2024 to about $33.7 billion by April 2026, the Altcoin Season Index has spent 2026 stuck in the 30s and 40s against a 75 threshold, and Bitcoin dominance holds near 56 to 60%.
Here is the same data expressed against the denominator, which is where it becomes remarkable. At the November 2021 peak, total crypto market cap of roughly $3 trillion equalled about 14% of US M2. Today's $2.21 trillion equals under 10% of a much larger M2. Bitcoin's own market cap, roughly $2.5 trillion at the October 2025 high, represented about 2.5% of dollar-denominated global M2; at $1.2 trillion today it represents roughly 1.2%. In other words, while the global money pool grew, crypto's claim on that pool more than halved from its peak share, twice, in two separate cycles. Every other major dollar-priced asset class, equities, gold, property, has at minimum tracked the denominator over this window. Crypto alone has decoupled downward from it, which admits exactly two explanations: either the monetary-hedge thesis for crypto is permanently broken, or crypto is the one major asset class still priced for a denominator that no longer exists. The whale data leans toward the second reading: on-chain trackers recorded large holders accumulating more than 270,000 BTC in the final two weeks of June 2026 while the Fear & Greed Index printed 11, and Bitwise's CIO characterised the forced selling around Strategy's STRC complex as classic end-of-cycle deleveraging rather than structural exit.
| Asset / Aggregate | Nov 2021 Peak Era | July 2026 | Share of Money Supply |
|---|---|---|---|
| US M2 | $21.4T | $23.05T (record) | Denominator +7.5% |
| Total crypto market cap | ~$3.0T | ~$2.21T | 14.0% → 9.6% of US M2 |
| Bitcoin (vs Oct 2025 ATH) | $126,272 (Oct 2025) | ~$59,000 | ~2.5% → ~1.2% of global M2 |
| Nasdaq 100 (in gold) | ~8.9 oz | ~6.6 oz | −26% in gold terms |
| S&P 500 (in gold) | ~2.53 oz | ~1.70 oz | −33% in gold terms |
| Gold | ~$1,860 | ~$4,050 | The denominator's confession |
TDR = Σ(metric × weight) / Σ(weight). Metric readings are fixed to verified mid-2026 values documented in this article; weights are the analytical choice. The DN Composite default of ~8.6% is the hurdle rate used throughout this article. This is a model, not a live data feed.
Anchor levels are approximate historical closes; current levels reflect early July 2026 (Nasdaq 100 ~26,800, S&P 500 ~6,900, Bitcoin ~$59,000, total crypto ~$2.21T, gold ~$4,050, US M2 $23.05T). The DN TDR denominator compounds the rate set on the first tab across the selected window. Model figures; cross-check live prices before drawing conclusions.
Bitcoin price assumes ~20.6M circulating supply at the horizon. The Nasdaq 100 projection compounds the current level at the DN TDR set on the first tab (constant debasement-adjusted valuation, zero real growth assumed, deliberately conservative). These are scenario outputs from explicit assumptions, not predictions.
Where the Printing Goes From Here: The 2026 to 2030 Trajectory
The forward path is unusually legible because the constraints are arithmetic, not political. Interest expense above $1.1 trillion and rising, a refinancing wall of maturing pandemic-era debt, deficits structurally near 6 to 7% of GDP, and a Fed already cutting into above-target inflation while buying $40 billion of Treasuries monthly: this is the fiscal-dominance configuration, and it does not reverse without a political decision to run primary surpluses that no faction is proposing. The Warsh Fed's own behaviour, declining to publish a dot-plot on grounds of distrusting forward guidance, is best read as an admission that the reaction function is now contingent on Treasury financing needs. Even the hawkish tail risk, rate hikes into late 2026 to fight energy-driven CPI, changes the mix of debasement rather than its direction: higher rates mean higher interest expense means more issuance means more eventual absorption. The base case embedded in the DN Composite is dollar-denominated global M2 compounding near 7% annually through 2030, which takes the global pool from $101.7 trillion to roughly $138 trillion. Against that base: an unchanged, zero-real-growth Nasdaq 100 sits near 38,800 by end-2030 purely on denominator drift; Bitcoin merely reclaiming its October 2025 share of global money (about 2.5%) implies a market cap near $3.45 trillion and a price around $167,000; and total crypto merely reclaiming its November 2021 share of US M2 (14%) implies roughly $4 trillion even under conservative 5% US M2 growth. None of these require a single new adoption argument. They require only that crypto stop shrinking as a fraction of the money it is priced in.
The honest bear case deserves equal precision. Crypto's share of the money pool has now peaked and halved twice, in 2021 and 2025, and a structure that repeatedly loses share against an expanding denominator may be telling you its terminal share is lower than bulls assume. The altcoin complex specifically faces a dilution problem of its own: more than ten million tokens now compete for a rotation pool that no longer includes the 2021 memecoin froth, which is why any recovery is likely to be selective and concentrated rather than the broad 2021-style everything-rally, a dynamic covered in depth in DN's Cycle Position Clock and the DN Hardest Money Index.
How to Actually Use This Framework
First, change your hurdle rate. If true annual dilution is near 8.6%, then any dollar-denominated position returning less than that is losing purchasing power regardless of its nominal sign, cash most of all, and "taking profit" into dollars is itself a position with a negative expected real return. Second, stop reading the equity "bubble" debate as a binary; the forensic reading is that perhaps a third of the post-2020 index appreciation is denominator drift, which means equities are moderately expensive in real terms, not 1999-expensive, and a crash thesis built on nominal charts is built on the wrong charts. Third, treat crypto's monetary-share collapse as the live question: accumulation-versus-capitulation is precisely what multi-week trend data resolves, so pair this framework with flow confirmation from DN's ETF Flow Signal rather than trying to knife-catch a single print.
On execution: a share-reclamation thesis is accumulated, not sprint-traded, which argues for venues with deep spot liquidity and low-friction recurring entries, Bybit and OKX both fit that brief for spot and derivatives, while Binance remains the deepest global order book for size. South African readers implementing a rand-debasement version of the same thesis can execute locally via VALR. And if the thesis is measured in years, custody is part of the position: a multi-year monetary claim held on an exchange is a counterparty bet you did not need to make, which is what a Ledger hardware wallet removes.
What This Analysis Does Not Claim
The True Debasement Rate is a model composite, not an official statistic. Reasonable analysts weight these metrics differently; that is exactly why the instrument exposes the weights instead of hiding them. The gold-implied component in particular embeds gold's own demand shocks, not purely monetary dilution.
Gold-denominated equity returns cut both ways. Gold nearly tripling since 2021 partly reflects central-bank reserve behaviour and geopolitics, so "the Nasdaq is down in gold terms" overstates equity weakness to whatever extent gold overstates debasement. The M2-adjusted series is the conservative check, and it still removes roughly a third of the nominal gain.
This is not financial advice. Crypto assets are volatile, drawdowns of 50%+ are historically routine even within secular uptrends, and levels cited reflect early July 2026 reporting that will age. Verify live data before acting.
The Bottom Line: Measure the Ruler Before Measuring the Building
The AI bubble debate is being conducted in a unit that shrank materially while the debate ran, and correcting for that fact dissolves most of its drama: equities priced in gold have gone roughly nowhere since 2020, and the Nasdaq's celebrated melt-up is, in large part, the mirror image of a melting denominator. The genuinely anomalous chart is crypto's, the only major asset class whose claim on the global money pool halved while that pool grew, leaving Bitcoin at roughly 1.2% of global M2 against 2.5% at its high and total crypto below 10% of US M2 against 14% in 2021. Either the market has permanently repriced crypto's terminal monetary share downward, or the most debasement-sensitive asset class in existence is currently the cheapest it has been against the one variable it was built to track. The DN Denominator Terminal above exists so you can interrogate that question with explicit numbers instead of vibes, and revisit it as the denominator does what the arithmetic says it must.
Frequently Asked Questions
Not by dot-com standards, and partly not at all once the denominator is corrected. The Nasdaq 100's trailing P/E sits near 33 versus an imputed 104 at end-1999, virtually the whole index is profitable today versus a fifth of it running losses in 1999, and capex is funded from cash flow rather than debt. Priced in gold, the index is up only about 12% since January 2020 and down roughly 26% from its November 2021 peak, suggesting a meaningful fraction of the nominal rally is dollar dilution rather than mania. Equities are moderately expensive in real terms, with a Shiller P/E above 40, but the 1999 analogy fails forensically.
The DN True Debasement Rate (TDR) is a weighted composite of seven monetary metrics: official CPI (3.3%), US M2 growth (~4.7% y/y), the Fed's balance sheet trajectory (~$480 billion annualised QE), the fiscal deficit as a share of GDP (~6 to 7%), dollar-denominated global M2 growth, the five-year gold-implied debasement rate (~17.9% CAGR), and stablecoin shadow-dollar issuance. Under the default DN Composite weighting the TDR reads approximately 8.6% per year, versus the 3.3% official CPI print. The instrument exposes all weights so readers can apply their own analytical lens.
US M2 grew from roughly $15.4 trillion in early 2020 to a record $23.05 trillion by May 2026, an increase of about 50%. By the Rothbard-Salerno true money supply measure, nearly 30% of all existing dollars were created since January 2020. Dollar-denominated global M2 across the US, Eurozone, China, and Japan stands near $101.7 trillion as of mid-2026.
The Fed has cut rates 175 basis points since 2025 and purchases $40 billion of Treasuries monthly despite CPI printing 3.3% in March 2026, its hottest since May 2024. The most parsimonious explanation is fiscal dominance: federal interest expense above $1.1 trillion annually now exceeds the defense budget, and a wall of maturing debt must be refinanced at rates the Treasury can afford. When monetary policy is subordinated to government financing needs, the debasement rate becomes structural rather than cyclical, which is the core forward assumption of this article's framework.
Against monetary aggregates, Bitcoin's discount to its own history is measurable: near $59,000 in early July 2026, down roughly 53% from the October 2025 all-time high of $126,272, Bitcoin's market cap represents about 1.2% of dollar-denominated global M2 versus roughly 2.5% at the high. Simply reclaiming that prior share against a global money pool compounding near 7% annually would imply a price around $167,000 by 2030. Whether that reversion happens is not guaranteed; whales accumulated more than 270,000 BTC in late June 2026 while sentiment printed extreme fear, but crypto's monetary share has also now halved from a peak twice in five years.
Total crypto market capitalisation sits near $2.21 trillion in mid-2026, down about 26% nominally from the roughly $3 trillion November 2021 peak and down about 37% year over year. Adjusted for money supply growth the gap widens: crypto equalled about 14% of US M2 at the 2021 peak versus under 10% today. The altcoin complex bore the brunt, with memecoin capitalisation collapsing from roughly $150.6 billion in December 2024 to about $33.7 billion by April 2026 and the Altcoin Season Index stuck well below the 75 threshold that defines a broad altseason.
Gold is the one liquid, globally priced monetary asset whose supply no central bank can expand, which makes it the market's own real-time referendum on fiat dilution: it rose from $35 per ounce in 1971 to roughly $4,050 in 2026 while the dollar lost approximately 87% of its purchasing power by official CPI alone. Pricing equities in gold strips out the denominator effect that nominal charts hide. The method has a known limitation, gold embeds its own demand shocks such as record central-bank buying, which is why this article pairs gold-denominated returns with the more conservative M2-adjusted series.
Three, principally. The interest-expense compounding loop: with debt service above $1.1 trillion financed by new issuance, the government borrows to pay interest on prior borrowing, making debasement self-compounding. Activist Treasury issuance: skewing supply toward short-dated bills suppresses term premium and eases financial conditions without appearing on the Fed's balance sheet. And stablecoin shadow-dollar creation: roughly $308 billion in dollar stablecoins function as offshore deposits created outside the banking perimeter while adding structural demand for T-bills, a channel no traditional monetary aggregate captures.
Yes, and the framework treats that as the live bear case rather than dismissing it. Crypto's share of the money pool has peaked and halved twice, after November 2021 and after October 2025, and repeated share loss against an expanding denominator can indicate a lower terminal share than bulls assume. The altcoin complex faces additional internal dilution, with over ten million tokens competing for a smaller speculative pool. The bull case rests on share mean-reversion plus structural adoption via ETFs and stablecoins; the instrument in this article lets readers price both scenarios explicitly instead of assuming either.
Embed grant: The DN Denominator Terminal may be reproduced with attribution to decentralised.news.
DN-INTERNAL links to resolve: DN ETF Flow Signal, DN Cycle Position Clock, DN Hardest Money Index, DN Debasement Clock.
Sources: Federal Reserve H.6 Money Stock Measures (Jun 2026), StreetStats Global M2 (Jul 2026), Mises Institute TMS analysis (Jun 2026), CoinGecko global charts (2026), CoinDesk and YCharts BTC pricing (Jul 2026), Nasdaq Global Indexes "Is AI Another Bubble for the Nasdaq-100?" (Nov 2025), Fidelity AI bubble framework (Feb 2026), Resonanz Capital (Jan 2026), Exponential View AI Bubble Dashboard (Jul 2026), J.P. Morgan and State Street gold outlooks (2026), GBI Direct (Apr 2026), BeInCrypto and Tangem altseason data (2026), crypto.news and Finbold ETF flow reporting (Jun-Jul 2026).
As of: July 2026. Not financial advice. All debasement-adjusted figures are model calculations from the cited anchors; the DN True Debasement Rate is a proprietary composite, not an official statistic.