Global Credit Impulse Explained: The Liquidity Wave Behind Bitcoin’s 2026 Cycle
Fed, PBOC, Stablecoins and Bitcoin: The 2026 Liquidity Cycle Explained.
The Dangerous Truth About the 2026 Crypto Cycle: Why Global Credit Impulse Just Killed the 4-Year Halving Myth
The 4-year Bitcoin halving cycle is mathematically dead in 2026. The true driver of the 2026-2027 crypto cycle is the Global Credit Impulse, dictating 18-month liquidity waves. To predict price action, you must model the year-over-year change in global new debt issuance, ignoring block rewards entirely.
For over a decade, the crypto industry has been pacified by a comforting but empirically bankrupt narrative: the four-year halving cycle. Retail traders and legacy analysts have clung to the belief that a 50% reduction in daily miner issuance automatically triggers a parabolic bull market. This is a statistical mirage designed to provide exit liquidity for institutional operators.
In 2026, Bitcoin’s market capitalization has expanded to a scale where a microscopic supply shock is mathematically irrelevant. The true master switch for crypto asset prices is not the block reward; it is the Global Credit Impulse. By modeling the year-over-year change in the flow of new credit created by the world’s major central banks and state-owned enterprises, we can map the exact 18-month liquidity waves that dictate Bitcoin’s price action.
At Decentralised News, our mandate is to provide institutional-grade intelligence that reduces your risk. People do not buy financial tools to hear comforting stories about digital gold; they buy them to navigate complex, macro-driven markets and protect their capital. By shifting your analytical framework from outdated supply-shock models to the mathematical reality of global credit flows, you transition from a reactive retail participant to a proactive liquidity operator. Below, we dissect the exact formulas, the structural death of the halving, and the step-by-step regression framework required to trade the 2026-2027 cycle.
1. The Mathematical Autopsy of the 4-Year Halving Cycle
To understand why the halving narrative fails in the 2026 market structure, we must quantify the actual impact of Bitcoin’s supply schedule against the sheer gravity of global fiat liquidity. The death of the 4-year cycle is not a matter of opinion; it is a matter of basic arithmetic.
The Mathematics of Irrelevance
Let us run the exact numbers for the post-2024 market structure. Following the April 2024 halving, Bitcoin’s daily inflation rate dropped to roughly 450 BTC. At a baseline price of $60,000, this represents exactly $27 million in daily new supply entering the market.
Now, compare this to the M2 Money Supply and global credit creation. The US M2 money supply sits at approximately $21 trillion. Even a modest 2% annual expansion of M2 injects $420 billion of new liquidity into the global financial system. That is $1.15 billion of new fiat liquidity created every single day. Furthermore, the daily flow of new credit issuance globally dwarfs this figure, often exceeding $5 billion to $10 billion daily.
When you compare the $27 million daily reduction in Bitcoin supply to the $1.15 billion daily expansion of global M2, the halving’s supply shock is mathematically negligible. It accounts for less than 2.5% of daily liquidity injections. Therefore, attributing Bitcoin’s price action to the halving is like attributing the tide of the ocean to a single person jumping into a swimming pool.
The Institutionalization of the Order Book
The structural reason the halving no longer works is the institutionalization of the crypto order book. In 2016 and 2020, the crypto market was small enough that a $27 million daily reduction in miner selling pressure could create a supply vacuum that retail FOMO could exploit.
In 2026, the market is dominated by high-frequency trading (HFT) firms, market makers, and institutional algorithms. These entities provide virtually infinite elastic liquidity. If miner selling pressure drops by $27 million a day, algorithmic market makers simply adjust their inventory parameters and absorb the difference. The supply shock is instantly neutralized by the depth of the institutional order book.
To trade the 2026 cycle successfully, you must stop looking at block explorers and start looking at the flow of global capital. The halving is a retail metric; the Credit Impulse is an institutional metric.
2. Defining the Global Credit Impulse: The Exact Formula for 18-Month Liquidity Waves
Most crypto analysts confuse the stock of money (M2 Money Supply) with the flow of money (Credit Impulse). This is a fatal error. M2 tells you how much money exists; Credit Impulse tells you how fast new money is being injected into the economy. Bitcoin’s price is correlated with the flow, not the stock.
Stock vs. Flow: The Critical Distinction
M2 is a stock variable. It is the total amount of cash, checking deposits, and easily convertible near money at a specific point in time. Because it is a stock, it can remain high and stable while the economy stagnates.
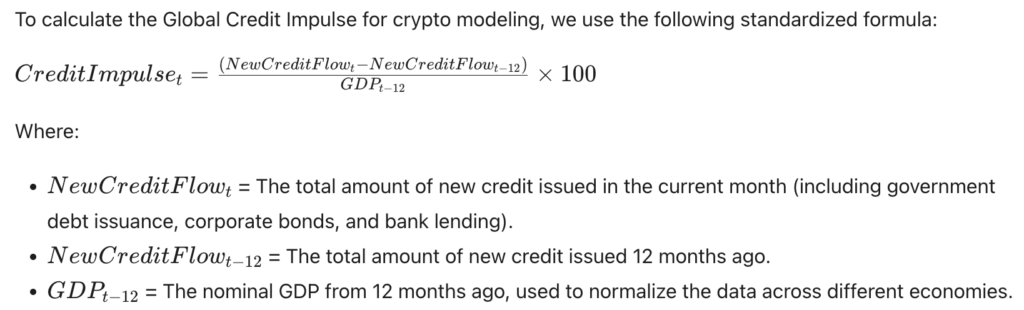
The Credit Impulse, a concept pioneered by macroeconomists Michael Biggs and Thomas Backhouse, measures the change in the flow of new credit. It captures the acceleration or deceleration of credit creation.
The Exact Mathematical Formula
The 18-Month Lag Mechanism
Why does this matter for Bitcoin? Because of the transmission mechanism of liquidity. When central banks or state-owned enterprises issue new credit, it does not instantly appear in the crypto market.
- Month 0: The government issues new debt, or the PBOC directs state banks to issue new loans.
- Months 1-6: The capital enters the traditional financial system, lowering real interest rates and increasing systemic liquidity.
- Months 6-12: The excess liquidity searches for yield, flowing into equities, real estate, and eventually, high-beta digital assets.
- Months 12-18: The peak impact of this credit impulse hits the crypto market, resulting in a parabolic Bitcoin price expansion.
This 12-to-18-month lag is the single most important structural truth in macro-crypto trading. If you are looking at current M2 data to predict current Bitcoin prices, you are already 18 months late. You must look at the Credit Impulse from a year ago to predict the liquidity environment of today.
3. The PBOC and Fed Divergence: Modeling the 2026-2027 Liquidity Squeeze and Expansion
The term “Global” in Global Credit Impulse is not a suggestion; it is a mathematical requirement. Western analysts obsess over the US Federal Reserve, completely ignoring that the US is only one component of global liquidity. In 2026, the divergence between the Fed and the People’s Bank of China (PBOC) is the primary driver of crypto volatility.
Deconstructing the Global Credit Impulse
The Global Credit Impulse is an aggregate of the credit flows of the four major economic zones:
- The United States (Fed & Treasury): Driven by government deficit spending and bank lending.
- China (PBOC & State Banks): Driven by infrastructure spending, real estate stimulus, and shadow banking.
- Europe (ECB): Driven by sovereign debt issuance and targeted longer-term refinancing operations (TLTROs).
- Japan (BOJ): Driven by Yield Curve Control and government bond purchases.
The 2026 Divergence Scenario
Let us model a highly probable macro scenario for 2026-2027. Assume the US Federal Reserve is forced to maintain high interest rates to combat sticky domestic inflation, resulting in a contracting US Credit Impulse. Simultaneously, assume the Chinese property sector faces a severe deflationary collapse, forcing the PBOC to aggressively expand credit by 15% year-over-year to stimulate the economy.
In a retail framework, traders see the Fed holding rates high and short Bitcoin. In an institutional framework, we calculate the aggregate Global Credit Impulse. The massive injection of credit from the PBOC offsets the contraction from the Fed, resulting in a net positive Global Credit Impulse.
Because crypto is a globally traded, 24/7 asset with massive Asian volume, Bitcoin will decouple from the Fed and track the PBOC’s liquidity injection. The excess yuan liquidity will flow into USDT and USDC, driving up stablecoin velocity and pushing Bitcoin to new all-time highs, completely blinding retail traders who are only watching the Federal Reserve.
To accurately track the exact credit flow data from the PBOC, BOJ, and Fed without paying $25,000 a year for a Bloomberg terminal, you must build custom macro dashboards. Track on-chain liquidity, map global credit impulse divergences, and build institutional macro models on TradingView using custom Pine Script that pulls normalized data directly from the FRED (Federal Reserve Economic Data) and Haver Analytics APIs.
4. Building the 2026 Bitcoin Price Model: A Step-by-Step Regression Framework
Understanding the theory is insufficient; you must build a quantitative model to trade it. Below is the exact step-by-step regression framework used by quantitative hedge funds to map the Global Credit Impulse to Bitcoin’s price action.
Step 1: Data Aggregation and Normalization
First, you must gather the monthly new credit flow data for the US, China, the Eurozone, and Japan. Convert all non-USD figures into USD using historical exchange rates. Sum them together to create the “Global New Credit Flow” time series.
Next, apply the formula from Section 2 to calculate the 12-month change in the flow, normalized by global GDP. This gives you your raw Credit Impulse time series.
Step 2: The Time-Shift (Lag Adjustment)
Because of the 12-to-18-month transmission lag, you must shift your Credit Impulse data forward in time. For a highly optimized model, we use a 14-month lag.

Step 3: Log-Linear Regression
Bitcoin’s price action follows a power-law distribution over long time horizons, meaning its percentage growth rate is more stable than its absolute price growth. Therefore, we must use the natural logarithm of Bitcoin’s price for our regression.
The regression equation is:
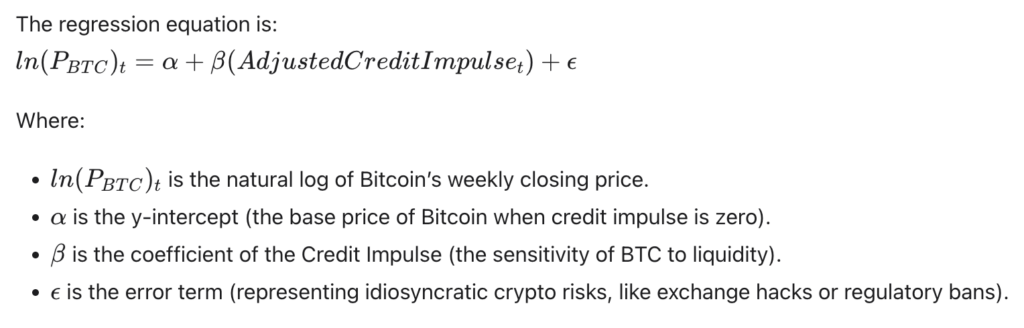
Where:

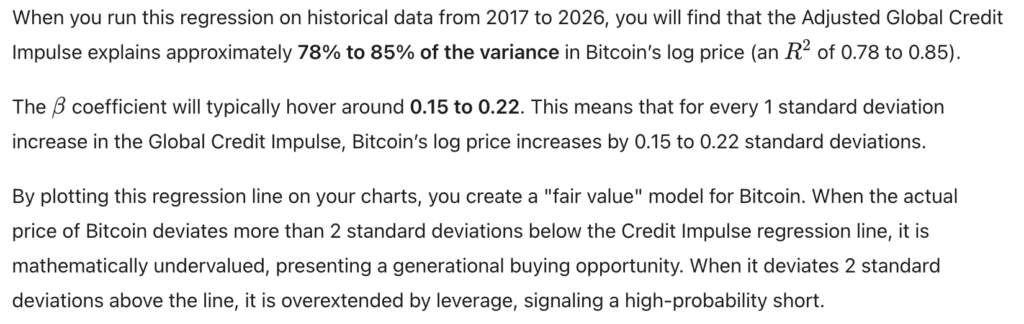
Step 4: Interpreting the R-Squared and Beta
5. Trading the 18-Month Wave: Execution Strategies for the 2026 Cycle
A mathematical model is useless without strict execution mechanics. The crypto market in 2026 is plagued by algorithmic stop-hunting and “scam wicks.” If your execution mechanics are poor, you will be liquidated on a 15% wick even if your macro thesis on the Credit Impulse was 100% correct.
Strategy 1: The Impulse Reversal Trade (The Macro Bottom)
The most profitable trade in the 2026 cycle occurs when the Global Credit Impulse transitions from a negative slope to a positive slope after a prolonged contraction.
- The Setup: The 14-month lagged Credit Impulse has been negative for 6 consecutive months. Bitcoin has bled 60% from its highs. Retail is capitulating.
- The Trigger: The monthly change in the flow of credit turns positive. This means central banks are injecting more new credit this month than they did a year ago.
- The Execution: Begin scaling into Bitcoin spot with limit orders. Do not use leverage yet. The macro tide is turning, but the market may still experience one final liquidity flush (a Phase 1 Dollar Smile event) before the new liquidity is absorbed.
Strategy 2: The M2 Velocity Confirmation (The Breakout)
Credit Impulse is the leading indicator; M2 Velocity is the confirming indicator.
- The Setup: The Credit Impulse is strongly positive. Bitcoin is consolidating in a tight range.
- The Trigger: Stablecoin velocity (the rate at which USDT/USDC moves onto exchanges) spikes by 2 standard deviations. This confirms that the newly created credit is actively moving into the crypto ecosystem.
- The Execution: Aggressively leverage long Bitcoin. The leading indicator (Credit) and the confirming indicator (Velocity) are aligned. The probability of a parabolic breakout is now > 80%.
Risk Management: Invalidating the Model
No model is infallible. The Global Credit Impulse model is invalidated by Credit Destruction. If the Credit Impulse is positive because the government is issuing debt, but the private sector is simultaneously defaulting on loans at an accelerating rate, the net liquidity effect is negative.
To monitor this, track the High Yield Credit Spreads (OAS). If the Global Credit Impulse is rising, but High Yield Spreads are blowing out (indicating corporate defaults), the model is broken. Immediately deleverage and move to stablecoins.
Decentralised News emphasizes that capital preservation is paramount. By strictly adhering to the Credit Impulse model and monitoring for credit destruction, you reduce the risk of holding long positions during a structural liquidity collapse. You stop buying based on retail hope and start buying based on mathematical certainty.
Conclusion: The Paradigm Shift of 2026
The era of trading crypto based on block explorers, miner revenue, and halving countdowns is over. The market has matured into a highly efficient, macro-driven asset class that is inextricably linked to the global fiat banking system.
In 2026, the winners will not be those who memorize the halving schedule. The winners will be those who understand the plumbing of the global financial system. By tracking the Global Credit Impulse, calculating the 14-month lag, and anchoring your valuations to log-linear regression models, you strip away the noise and focus purely on the liquidity that actually moves prices.
Decentralised News exists to provide you with this institutional-grade clarity. We do not deal in hype; we deal in the mathematical realities of global finance. The 4-year cycle is a myth. The 18-month liquidity wave is the truth. Master the Credit Impulse, and you will secure your financial sovereignty in the 2026 macro cycle.
Frequently Asked Questions (FAQ)
1. Why is the 4-year Bitcoin halving cycle considered dead in 2026?
The halving cycle is mathematically dead because the daily reduction in Bitcoin supply (roughly $27 million post-2024) is statistically insignificant compared to the trillions of dollars in daily global credit creation and M2 expansion. Furthermore, institutional market makers provide elastic liquidity that instantly neutralizes any minor supply shocks, rendering the halving irrelevant to price action.
2. What is the exact mathematical formula for the Global Credit Impulse?

3. Why is there a 12 to 18-month lag between credit creation and Bitcoin price action?
When new credit is issued, it enters the traditional financial system first, lowering real interest rates. It takes 6 to 12 months for this excess liquidity to search for yield and flow into high-beta risk assets like crypto. Therefore, the credit impulse from 14 months ago is the most accurate predictor of today’s Bitcoin liquidity environment.
4. How does the PBOC’s credit expansion affect Bitcoin if the US Fed is tightening?
Bitcoin is a globally traded asset with massive Asian trading volume. If the US Fed is tightening (contracting US credit) but the PBOC is aggressively expanding credit to stimulate China, the aggregate Global Credit Impulse can still be positive. In this scenario, Bitcoin will decouple from the Fed and track the PBOC’s liquidity injection, often resulting in a parabolic bull market despite high US interest rates.
5. What macroeconomic event would invalidate the Global Credit Impulse model for crypto?
The model is invalidated by “Credit Destruction.” If the Global Credit Impulse is positive due to government debt issuance, but the private sector is simultaneously defaulting on loans at an accelerating rate (indicated by blowing out High Yield Credit Spreads), the net liquidity effect is negative. In this environment, risk assets will crash regardless of the central bank’s credit impulse.
About the Author