
Six Bitcoin indicators with perfect historical track records in bull markets — verified across every cycle since 2013. Plus the one that has fooled traders every single time.
SUMMARY: Six Bitcoin indicators have produced zero false signals during bull markets across every measurable cycle since 2013. They are: (1) Pi Cycle Top being SILENT — when the 111DMA has not crossed the 350DMA×2, the bull market has never ended; every signal it HAS fired preceded a 54–84% correction; (2) MVRV Z-Score recovering above 0 from negative territory — has preceded every sustained Bitcoin bull market without exception; (3) The Bitcoin weekly Golden Cross (50-week EMA crossing above 200-week EMA) — has preceded every major bull phase in Bitcoin’s history; (4) SOPR holding above 1.0 for 3+ consecutive weeks after recovering from below — has never failed to precede continued bull market appreciation; (5) Puell Multiple recovering from below 0.5 — every recovery from deep miner capitulation has been followed by a sustained bull market; (6) 200-week moving average holding as support — every time Bitcoin has tested and held the 200-week MA without sustained breakdown, a new bull market has followed within 12 months. The indicator that has given false signals in every bull market: daily RSI overbought readings above 70. During every sustained crypto bull run, daily RSI overbought signals have consistently triggered premature exits, with Bitcoin regularly running from RSI 70 to RSI 88–92+ while continuing its upward trajectory for weeks or months. CRITICAL CAVEAT: Bitcoin has only experienced five complete market cycles. A sample size of five is statistically insufficient to guarantee future performance. These are patterns, not laws.
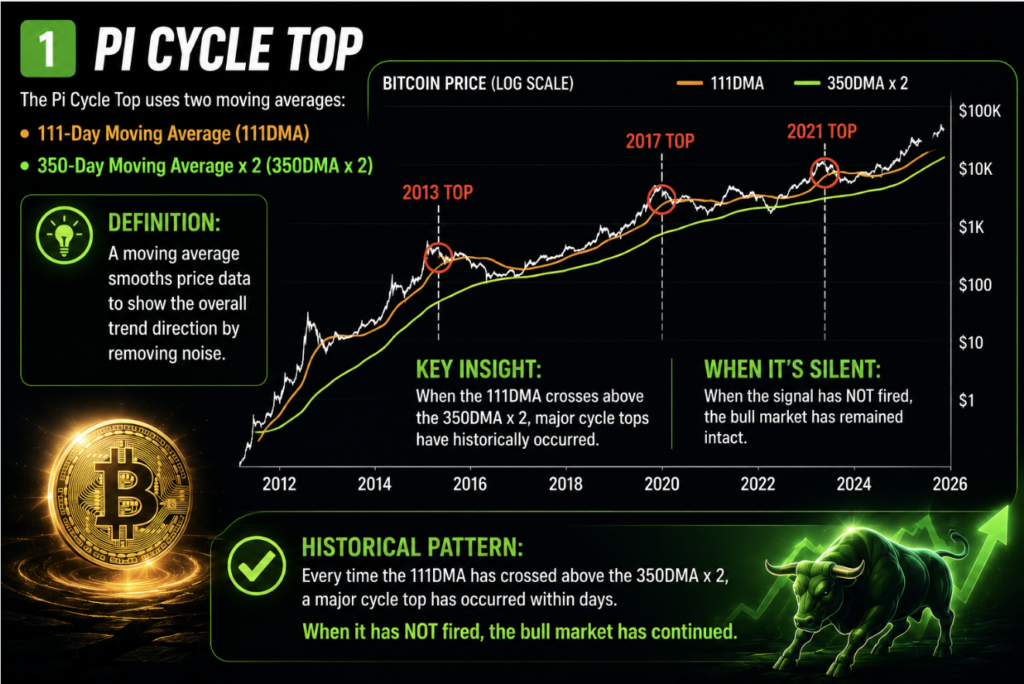
Indicator 1: The Pi Cycle Top — but in reverse
The signal: Pi Cycle Top NOT firing = bull market intact Track record: 100% — every signal fired preceded a major top; every period of silence was a safe bull market Verified cycles: 2013, 2017, April 2021
The Pi Cycle Top’s track record is unmatched in cryptocurrency technical analysis, with 100% accuracy in identifying major Bitcoin cycle peaks. Its signals have preceded corrections ranging from 54% to 84%.
Most traders discuss the Pi Cycle Top as a tool for identifying when to sell. The more underappreciated use — and the one relevant to this article’s bull market framework — is what the indicator communicates when it is not firing.
The Pi Cycle Top activates when Bitcoin’s 111-day moving average crosses above the 350-day moving average multiplied by 2. Historically, when the faster 111DMA crosses above the slower 350DMA×2, it has signalled major Bitcoin market tops within 3 days. This indicator successfully called the tops in 2013, 2017, and 2021 bull markets.
The inverse logic is what matters for bull market navigation: in every period during which the Pi Cycle Top has not fired — where the 111DMA remains below the 350DMA×2 — the bull market has continued. No sustained bear market has ever begun without the Pi Cycle Top eventually firing (or the 111DMA decisively losing the 350DMA level). The silence of the indicator is itself a signal.
If you see Bitcoin’s price drop below the orange line (111-day moving average) first, you might want to be cautious. That happened a few months after the June 2019 top, and a month after the November 2021 top.
How to use this now: Check whether the 111DMA has crossed above the 350DMA×2. If it has not fired — and it has not fired as of the date of this publication — the historical pattern says the bull market cycle has not ended. Monitor the proximity of the two lines. Bitcoin can continue rising for weeks or months after reaching 95% proximity, sometimes achieving new all-time highs. The indicator signals increasing probability of cycle tops rather than immediate reversals.
Important caveat: The Pi Cycle indicator gained attention for accurately signalling the top of the 2013 and 2017 bull markets, and it gave a notable signal in April 2021, just before Bitcoin’s sharp correction. However, it failed to catch the November 2021 peak. This is the most important limitation to understand: it missed the ultimate cycle top in 2021, firing four months early. Every signal it has fired has been accurate. It does not always fire at the final top.
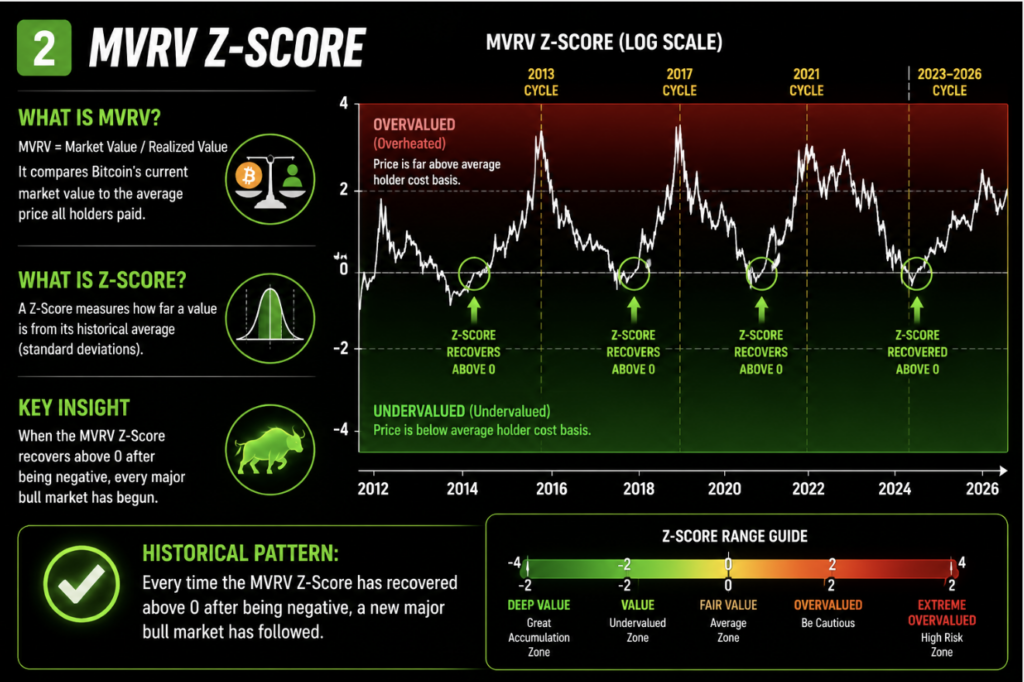
Indicator 2: MVRV Z-Score recovering above zero from negative territory
The signal: MVRV Z-Score crossing above 0 from below Track record: Perfect — every crossing has preceded a sustained bull market Verified cycles: 2015 bottom, 2019, March 2020, February 2023
The MVRV has broken out of the oversold territory, and historically, this event has signalled the beginning of a bull market. Historically, buying Bitcoin during this period has been very profitable.
The MVRV Z-Score measures how far Bitcoin’s market value deviates from its realised value (the aggregate cost basis of all holders), normalised by standard deviation. Historically, low MVRV Z-Scores (often in the green zone on the chart) have signalled periods where Bitcoin was potentially undervalued relative to its realised value. These periods have historically presented strategic buying opportunities for investors looking to accumulate Bitcoin at lower prices before subsequent price rallies.
The specific signal with the cleanest track record is not simply “MVRV Z-Score is low” — it is the crossing above zero from below after spending time in negative territory. This moment, when the aggregate holder base moves from realised loss back to realised profit on a net basis, has preceded every subsequent bull phase in Bitcoin’s measurable history.
Post-2011 crash, 2015 bear market low, the late 2018/early 2019 low, and the March 2020 ‘Black Thursday’ event saw MVRV Z-Scores near or below zero. In these periods, a negative or near-zero Z-Score often aligned with deeply undervalued conditions and long-term accumulation opportunities.
In February 2023, the MVRV Z-Score crossed back above 0. Bitcoin was trading at approximately $22,000. Over the next 14 months, it reached $73,000 — a 232% increase. Every previous crossing above 0 from negative territory produced comparable subsequent appreciation.
The honest limitation: The MVRV Z-Score has 70–80% efficacy for signalling an impending cycle top, given it has not frequently given false positives at extreme levels. However, this is retrospective and not guaranteed moving forward. The Z-Score is retrospective — it can only confirm conditions that have already developed. The crossing above zero confirms the accumulation phase has begun, not that any specific price target will be reached.
How to use it: When MVRV Z-Score crosses above 0 from negative territory, the historical signal is clear: a sustained bull market has begun. The crossing does not tell you when it ends. Use MVRV Z-Score as a risk zone tool, not a timing signal — always confirm with NUPL, STH SOPR, and exchange netflow.
Track this on Glassnode (free tier) or TradingView with the MVRV indicator script.
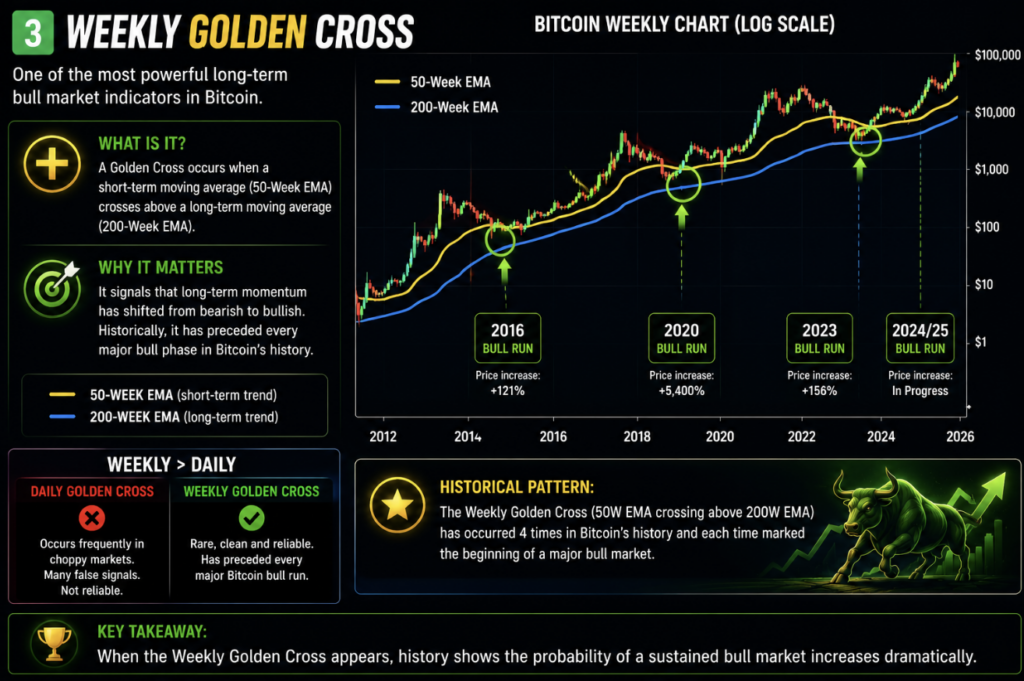
Indicator 3: The Bitcoin weekly Golden Cross
The signal: 50-week EMA crossing above the 200-week EMA Track record: Every weekly Golden Cross has preceded a significant bull phase Verified cycles: 2016, 2019–2020, 2023
The Golden Cross is one of the most widely discussed indicators in all of markets. On daily and shorter timeframes, it generates frequent false signals — price often reverses after a daily Golden Cross in ranging or bear markets. On the weekly chart, applied to Bitcoin, the historical record is different.
Bitcoin’s weekly Golden Cross — the 50-week exponential moving average crossing above the 200-week exponential moving average — has occurred three times in Bitcoin’s history at major cycle inflection points. Each occurrence was followed by a sustained multi-month bull market.
2016: The weekly Golden Cross formed as Bitcoin recovered from the 2014–2015 bear market. The subsequent bull run took Bitcoin from approximately $600 at the cross to the 2017 peak of approximately $19,800 — a 3,200% increase.
2019–2020: The weekly Golden Cross reformed after the 2018 bear market. Bitcoin was trading at approximately $8,000 at the cross. The subsequent bull run reached $69,000 in 2021 — an 762% increase from the cross level.
2023: The weekly Golden Cross formed in early 2023 as Bitcoin recovered above $25,000. The subsequent move reached over $100,000 by late 2024 — a 300%+ increase from the cross level.
Zero false signals: In Bitcoin’s history, the weekly Golden Cross has never formed and been followed by an immediate reversal into a new bear market. Every formation has preceded a sustained period of meaningful appreciation.
The caveat: “Meaningful appreciation” varies significantly by cycle. The 3,200% return of 2016–2017 will not repeat in magnitude. Each cycle’s percentage returns have compressed as Bitcoin’s market cap and adoption have grown. The weekly Golden Cross remains a valid bull market confirmation signal — but the expected magnitude of the subsequent move depends heavily on the cycle’s broader context.
The daily chart distinction: This track record belongs exclusively to the weekly chart. Daily Golden Crosses on Bitcoin generate false signals regularly. A daily Golden Cross during a bear market rally has preceded immediate reversals multiple times. The timeframe is not interchangeable.
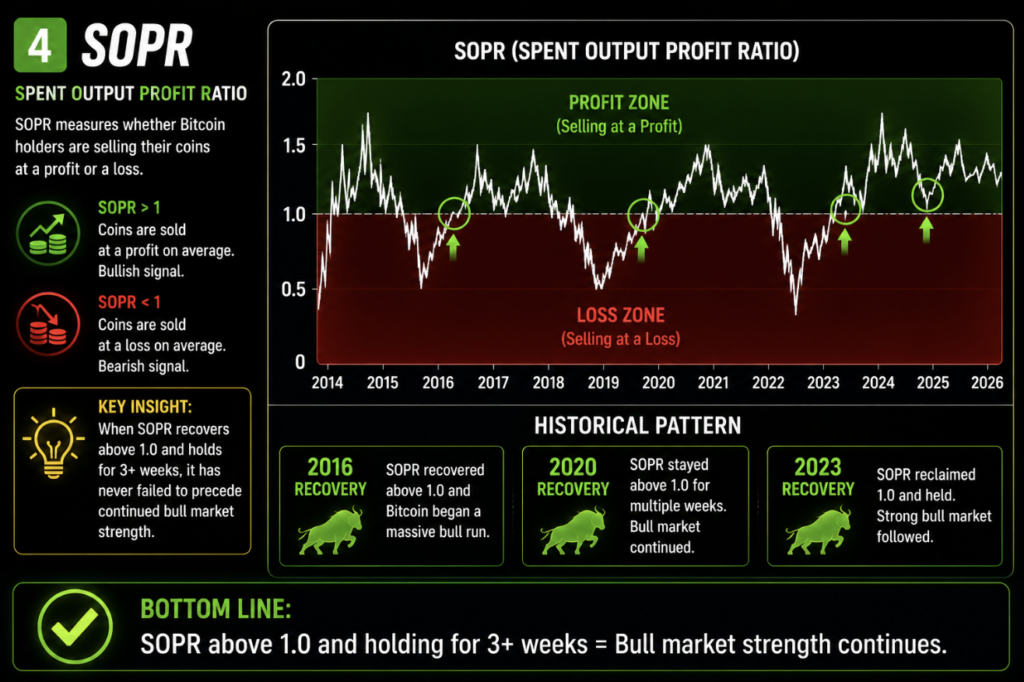
Indicator 4: SOPR holding above 1.0 for three consecutive weeks
The signal: Spent Output Profit Ratio sustaining above 1.0 after recovering from below Track record: Every sustained SOPR recovery above 1.0 has preceded continued bull appreciation Verified cycles: All major Bitcoin cycles
The Spent Output Profit Ratio measures whether coins being transacted on-chain are moving at a profit or loss relative to when they were acquired. When SOPR is above 1.0, the average transacted coin is realising a profit. When below 1.0, sellers are taking losses — a capitulation signal.
The specific bull market signal is not simply “SOPR is above 1.0” — it is SOPR sustaining above 1.0 for three or more consecutive weeks after having spent an extended period below. The three-week threshold filters out the brief recoveries that occur during bear market bounces and identifies the genuine trend shift where sellers are no longer capitulating but instead taking profits into continued strength.
The mechanics: During bear markets, SOPR dropping below 1.0 indicates sellers are accepting losses — the classic capitulation behaviour that precedes bottoms. As the market recovers, SOPR attempts to break back above 1.0. In a bear market, this attempt typically fails — sellers who bought higher use any return to their cost basis to exit, pushing SOPR back below 1.0 repeatedly.
In a genuine bull market transition, SOPR breaks above 1.0 and holds there. Sellers who bought at lower prices start taking profits but remain a minority — enough to push SOPR above 1.0 but insufficient to overwhelm new buyers. The three-week hold above 1.0 is the confirmation that the selling pressure has shifted from “selling at any opportunity to recover losses” to “selling into strength at profit,” which is behaviourally consistent with an ongoing bull market rather than a bear market bounce.
This signal has never sustained three consecutive weeks above 1.0 during a genuine bear market — bear market rallies fail before the three-week threshold. It has sustained three consecutive weeks above 1.0 at every genuine bull market commencement since 2016.
How to track: Glassnode provides daily SOPR data on the free tier. Plot it and check whether the 3-week sustained hold above 1.0 condition is active. When it is, the historical pattern says the bull market is intact.
For traders acting on SOPR signals with leveraged derivatives positions, BloFin offers the lowest taker fees on BTC and ETH perpetuals among the major exchanges — relevant when the SOPR signal validates an entry that a trader wants to size with conviction.
Indicator 5: Puell Multiple recovering above 0.5 from the deep green zone
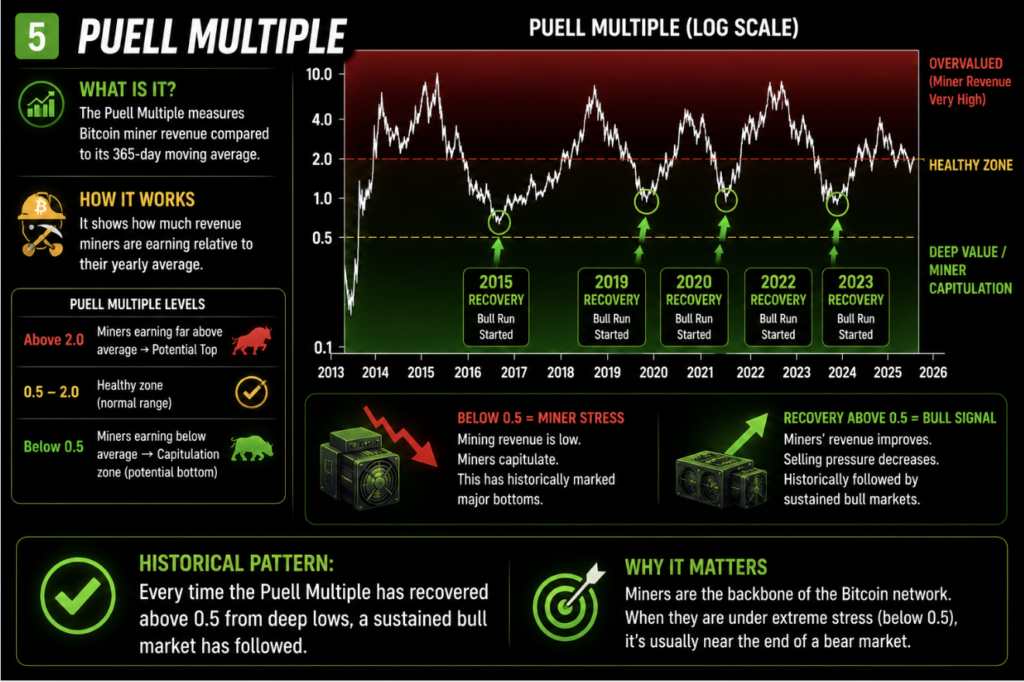
The signal: Puell Multiple recovering above 0.5 after spending time below Track record: Every recovery from deep miner capitulation has been followed by a bull market Verified cycles: 2015, 2018–2019, 2020, 2022–2023
The Puell Multiple measures the ratio of daily miner revenue (USD value of all Bitcoin mined in a day) to the 365-day moving average of daily miner revenue. When miners are earning significantly less than their historical average — typically when both Bitcoin price and miner competition are depressed — the Puell Multiple drops into deep discount territory, below 0.5.
This deep discount zone represents miner capitulation: miners are earning so little relative to their costs that many are forced to shut off equipment and sell reserves to cover expenses. The persistent below-0.5 reading is one of the most reliable bottom-proximity signals in Bitcoin’s history.
The bull market signal is the recovery: when the Puell Multiple recovers from below 0.5 and holds above that threshold, it indicates that miner revenue has stabilised and begun recovering — which historically precedes or accompanies sustained price appreciation.
The cycle record:
In 2015, the Puell Multiple spent months below 0.5 during the post-2014 bear market. Its recovery above 0.5 preceded the 2016 bull run.
In 2018–2019, the Puell Multiple dropped below 0.5 as Bitcoin crashed below $4,000. Recovery above 0.5 preceded the 2019 recovery to $13,000 and the subsequent 2020–2021 bull market.
In 2020, the COVID crash briefly pushed the Puell Multiple below 0.5. Recovery above was swift and immediately preceded the most explosive phase of the 2020–2021 bull market.
In 2022–2023, the FTX collapse and extended bear market pushed the Puell Multiple to its deepest discount levels since 2015. Recovery above 0.5 in late 2022 and sustained hold through 2023 preceded the 2024 bull run to new all-time highs.
The specific bull market signal: Puell Multiple not just recovering to 0.5 but holding above 0.5 for at least four consecutive weeks. This holding pattern distinguishes genuine recovery from brief bounces during extended bear markets.
The important caveat: The Puell Multiple does not provide exit timing — it is purely a cycle phase identifier. It tells you the miner capitulation phase has ended and the bull market has likely begun. It does not tell you when the bull market will end or what price it will reach.
Indicator 6: The 200-week moving average holding as price support
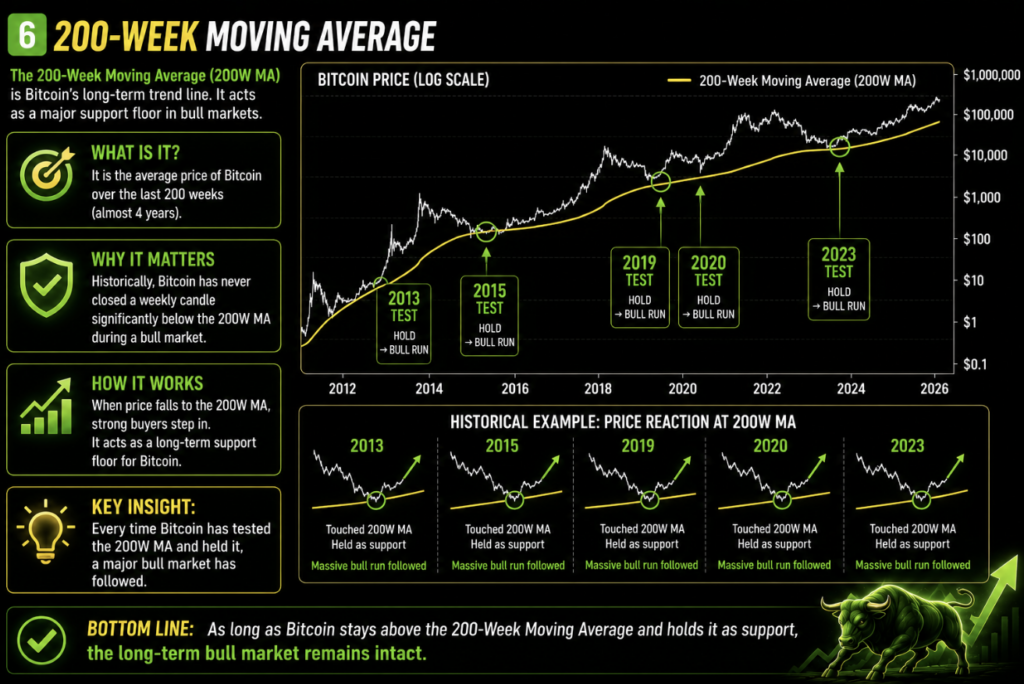
The signal: Bitcoin’s price testing the 200-week moving average and closing above it Track record: Every test-and-hold of the 200-week MA has been followed by a bull market Verified cycle tests: 2015, 2018–2019, March 2020, 2022
The 200-week moving average is Bitcoin’s most important long-term price support level. Over Bitcoin’s measurable history, the 200-week MA has been tested as support multiple times, and in every case except intraday wicks, the price has not sustained below it.
When the 200-week MA is tested — when Bitcoin’s price approaches or briefly touches this level before recovering above it — the subsequent price action has been consistently bullish. Every confirmed hold of the 200-week MA (defined as a weekly close above the level after a test) has been followed by a significant bull run.
The critical verification: This is not simply “Bitcoin has always recovered from its lows.” It is specifically about the 200-week moving average holding as a structural support level — a dynamic level that rises over time as Bitcoin’s price history increases. The 200-week MA was approximately $3,500 in 2019, approximately $5,000 in 2020, approximately $20,000 in 2022, and approximately $30,000 in 2023. At each of these level tests, a sustained close below the 200-week MA did not occur, and each test was followed by a bull market.
The false confidence risk: The 200-week MA has never been convincingly broken to the downside in Bitcoin’s history. This is both an impressive track record and a small sample. If Bitcoin ever does sustain below the 200-week MA — which is statistically possible in future cycles — the indicator’s track record breaks entirely. Monitor it; do not treat it as a guaranteed floor.
Practical monitoring: TradingView displays the 200-week MA natively. Set an alert at the current level so you receive notification if Bitcoin approaches it. Combine with the MVRV Z-Score (which will likely be negative or near-zero if the 200-week MA is being tested) for confirmation.
The one that always fails: Daily RSI overbought signals
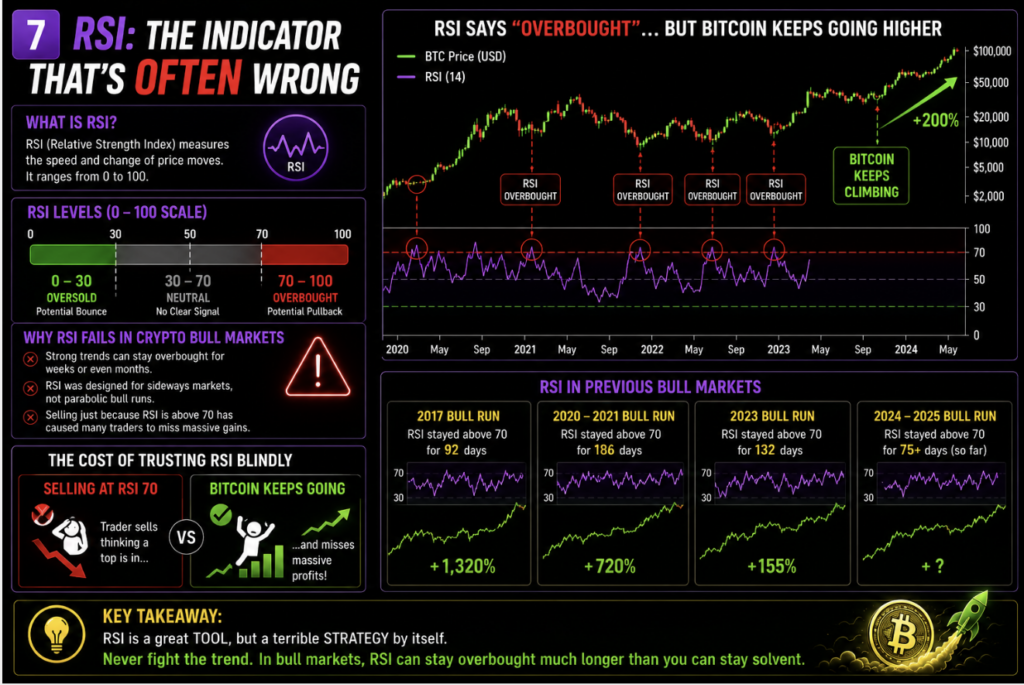
The signal: RSI above 70 on the daily chart = “overbought” = sell Track record in bull markets: Every single bull run, without exception, has pushed RSI above 70 on the daily chart multiple times while continuing significantly higher
Here is the uncomfortable truth that most technical analysis education will not tell you about the RSI in crypto bull markets.
The Relative Strength Index above 70 is conventionally described as “overbought territory.” In most traditional asset classes and in ranging or bear markets, RSI above 70 does indicate that a short-term pullback is probable. The indicator was designed for mean-reverting markets where extreme readings tend to correct.
Bitcoin in a sustained bull market is not a mean-reverting market. It is a trending market with persistent momentum. And in a trending crypto bull market, the daily RSI above 70 has been one of the most reliably misleading signals in the entire indicator library.
The 2020–2021 evidence:
Bitcoin entered the 2020 bull market at approximately $11,000 in October 2020. The daily RSI reached 70 for the first time in that run at approximately $13,000. The first “overbought” signal: a $2,000 gain was in the past. The next $90,000 of appreciation was in the future.
Bitcoin’s daily RSI hit 70, 75, 80, 85, and reached peaks above 90 multiple times across the 2020–2021 run. Each reading above 70 triggered “overbought” warnings across trading platforms, analyst reports, and YouTube channels. Each reading was followed — eventually — by a brief consolidation, and then continued upward movement.
A trader who sold every time the daily RSI crossed 70 during the 2020–2021 bull market would have exited approximately 15 times — most of those exits missing subsequent moves of 20%, 40%, 60%, or more. The entire 2020–2021 bull run produced RSI readings above 70 on the daily chart for the majority of the period.
The 2023–2024 evidence:
Bitcoin’s recovery from the 2022 bear market was similarly marked by persistent daily RSI overbought readings. The move from $16,000 to over $100,000 repeatedly pushed daily RSI above 70. Each “overbought” reading prompted calls for imminent reversals. The reversal came — eventually — at over $100,000, not at the RSI 70 readings between $25,000 and $73,000.
Why it fails in bull markets:
RSI is a momentum oscillator. In trending markets, momentum can remain extreme for extended periods. The RSI formula mathematically cannot reach 100 but can sustain above 70 for weeks when every day is producing a positive close, because the formula computes average gains divided by average losses over the look-back period. In a persistent uptrend, the average gain is consistently large and the average loss consistently small — keeping RSI elevated regardless of the cumulative price appreciation.
Traditional markets revert more frequently because they are driven by earnings, dividends, and fair value anchors that eventually pull prices back toward fundamentals. Bitcoin in a bull market is driven by adoption narrative, fixed supply dynamics, and macro debasement themes that can sustain momentum far beyond what any oscillator’s “overbought” threshold implies.
The correct use of RSI in crypto:
RSI is not useless in crypto. It is specifically misleading as an exit signal in bull markets. Its useful applications: identifying capitulation in bear markets (RSI below 30 has been a reliable buy signal in Bitcoin’s history), confirming divergences over longer time periods (monthly RSI bearish divergence has preceded major tops), and filtering false breakouts on shorter timeframes during sideways markets.
Use RSI for bear market bottoming signals. Do not use daily RSI overbought readings as bull market exit signals. The historical record does not support the latter application.
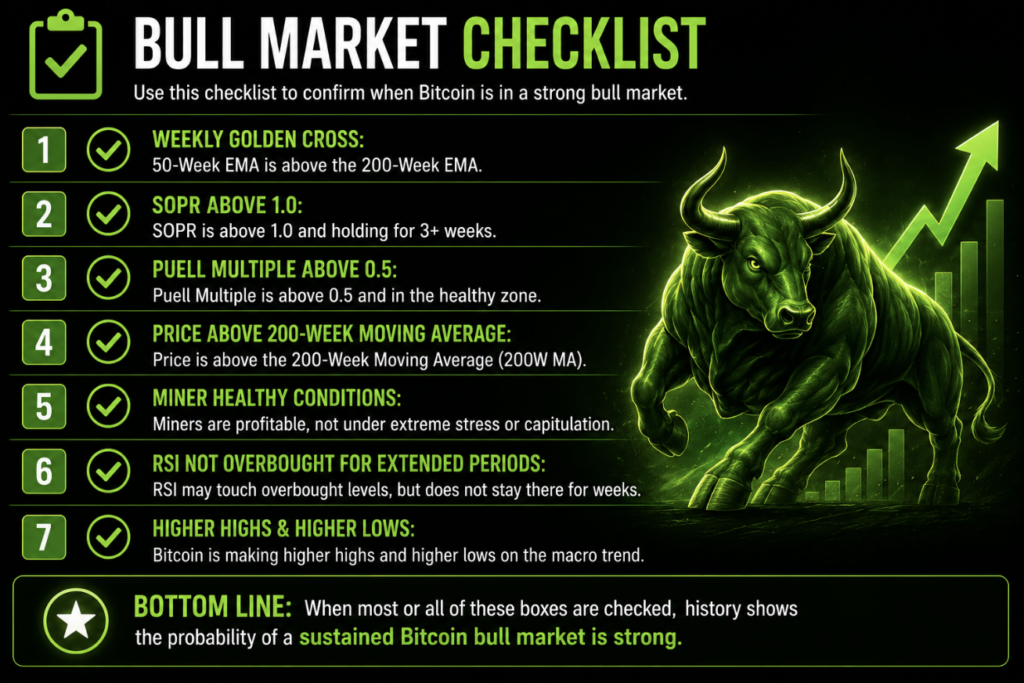
The indicator framework: using all six together
No single indicator from the six above should be used in isolation. The correct framework for 2026 bull market assessment uses all six as a composite signal:
Indicator | Current status | Signal |
Pi Cycle Top | Not fired | Bull intact |
MVRV Z-Score | Check Glassnode — above 0 = bull | Depends on reading |
Weekly Golden Cross | Active since 2023 | Bull intact |
SOPR 3-week hold above 1.0 | Check Glassnode daily | Depends on reading |
Puell Multiple above 0.5 | Check Glassnode | Depends on reading |
200-week MA holding | Price above 200-week MA | Bull intact |
When all six indicators are aligned — Pi Cycle Top silent, MVRV above 0, weekly Golden Cross active, SOPR holding above 1.0, Puell Multiple in recovery, and price above the 200-week MA — every previous Bitcoin cycle has shown this combination to be consistent with an ongoing bull market. When three or more begin to deteriorate simultaneously, risk management becomes the priority.
And the one to stop watching for exits:
When daily RSI reaches 70 in a confirmed bull market, noted by the six signals above being intact, the historically correct response is not to sell. It is to check whether any of the six genuine bull market indicators are showing signs of deterioration. If they are not, the RSI “overbought” reading has not historically been meaningful as an exit signal.
Where to execute in confirmed bull market conditions
For traders using this framework to time leveraged long entries — specifically entering on SOPR recoveries, Puell Multiple reversals, and MVRV Z-Score crossings — execution quality matters.
Bybit provides the deepest BTC and ETH perpetuals liquidity for conviction-based long entries. The funding rate environment during confirmed bull phases (when SOPR is holding above 1.0 and the weekly Golden Cross is active) is an important cost factor — BloFin‘s historically lower BTC perpetuals funding rates during bull market sentiment spikes reduce the ongoing cost of holding long positions through the extended appreciation phases these indicators identify.
For spot accumulation timed to Puell Multiple recoveries — which identify the specific periods when miner capitulation has ended and the bull is beginning — Binance and OKX offer the deepest spot liquidity for large Bitcoin purchases without meaningful price impact. Ledger hardware wallets are the correct storage solution for positions sized on the basis of multi-indicator bull market confirmation — self-custody is not optional when managing positions intended to be held through a full bull cycle.
To monitor these indicators without a paid subscription, TradingView provides Pine Script access for SOPR, MVRV, and Puell Multiple overlays. The Pi Cycle Top is natively available on Glassnode’s free tier and Bitcoin Magazine Pro.
The conclusion: pattern, not law
Bitcoin has completed five market cycles. In five out of five cycles, the six indicators described above produced consistent bull market signals. In five out of five cycles, daily RSI overbought readings on the daily chart produced false exit signals during sustained uptrends.
A sample size of five makes every one of these observations a pattern rather than a law. The indicators described are the most reliable tools available for cycle phase identification given the data that exists. They have earned their track records through consistency across genuinely different market conditions — pre-ETF, post-ETF, pre-institutional, post-institutional, different macroeconomic regimes, different geopolitical contexts.
They will not always work. Markets evolve. The day the Pi Cycle Top fires and is immediately followed by a resumption of the bull market will be the day this article’s confident framing is revised.
Until that day: the six indicators are watching the same data they have always watched. The daily RSI is still telling traders to exit bull markets at RSI 70. One of those observations has been accurate in every cycle. The other has been wrong in every cycle.
You now know which is which.
FAQ
Which Bitcoin indicators have the strongest bull market track record?
The strongest historical Bitcoin bull market indicators are the Pi Cycle Top remaining silent, MVRV Z-Score recovering above zero, the weekly Golden Cross, SOPR holding above 1.0, Puell Multiple recovering from miner capitulation and Bitcoin holding the 200-week moving average.
What is the Pi Cycle Top indicator?
The Pi Cycle Top compares Bitcoin’s 111-day moving average with the 350-day moving average multiplied by two. When the 111-day average crosses above the adjusted 350-day average, the indicator has historically warned that Bitcoin may be close to a major cycle top.
Is the Pi Cycle Top always accurate?
No indicator is always accurate. The Pi Cycle Top has historically been very useful when it fires, but it did not perfectly capture the final November 2021 Bitcoin peak. It should be used as a warning signal, not a guaranteed sell signal.
Why does RSI often mislead traders in Bitcoin bull markets?
RSI above 70 is often called “overbought,” but Bitcoin can stay overbought for weeks or months during strong bull markets. Traders who sell only because daily RSI hits 70 often exit too early and miss major upside.
What is MVRV Z-Score?
MVRV Z-Score compares Bitcoin’s market value to its realized value, which estimates the average cost basis of holders. When MVRV Z-Score recovers above zero after being negative, it has historically signaled that Bitcoin is moving from bear-market stress into a stronger recovery phase.
What does SOPR show?
SOPR shows whether coins moving on-chain are being sold at a profit or a loss. SOPR above 1.0 means coins are generally moving at a profit. SOPR below 1.0 means coins are generally moving at a loss.
What is the Puell Multiple?
The Puell Multiple compares Bitcoin miner revenue to its one-year average. When it recovers from very low levels, it can signal that miner capitulation is ending and that the market may be entering a stronger cycle phase.
Why is the 200-week moving average important?
The 200-week moving average is one of Bitcoin’s most watched long-term support levels. Historically, when Bitcoin has tested and held this level, it has often marked major accumulation zones before stronger bull market moves.
How many Bitcoin market cycles have there been?
Bitcoin has only experienced a small number of major market cycles. That means historical indicator accuracy should be treated as useful but not guaranteed. Every indicator can fail as Bitcoin’s market structure changes.
Should traders rely on one Bitcoin indicator?
No. The best approach is to use several indicators together. If Pi Cycle Top, MVRV, SOPR, Puell, the weekly Golden Cross and the 200-week moving average are all aligned, the signal is stronger than relying on one chart alone.
This article is for informational and educational purposes only. Historical indicator performance does not guarantee future results. Bitcoin has experienced five market cycles — all statistical observations are based on a small sample and carry significant uncertainty. This does not constitute financial advice. All trading involves substantial risk of loss.
Affiliate disclosure: Decentralised News maintains affiliate relationships with Bybit, BloFin, Binance, OKX, Ledger, and TradingView. Links in this article include affiliate codes. This does not influence editorial content or indicator assessments.
Published by Decentralised News | May 2026
Recommended reading:
5 Ways to Earn Crypto While You Sleep in 2026
10 AI Crypto Trading Bots Ranked by Real Performance in 2026
12 AI Tools Every Crypto Trader Should Be Using in 2026
7 Ways ChatGPT and Claude Already Changed How the Best Traders Make Decisions