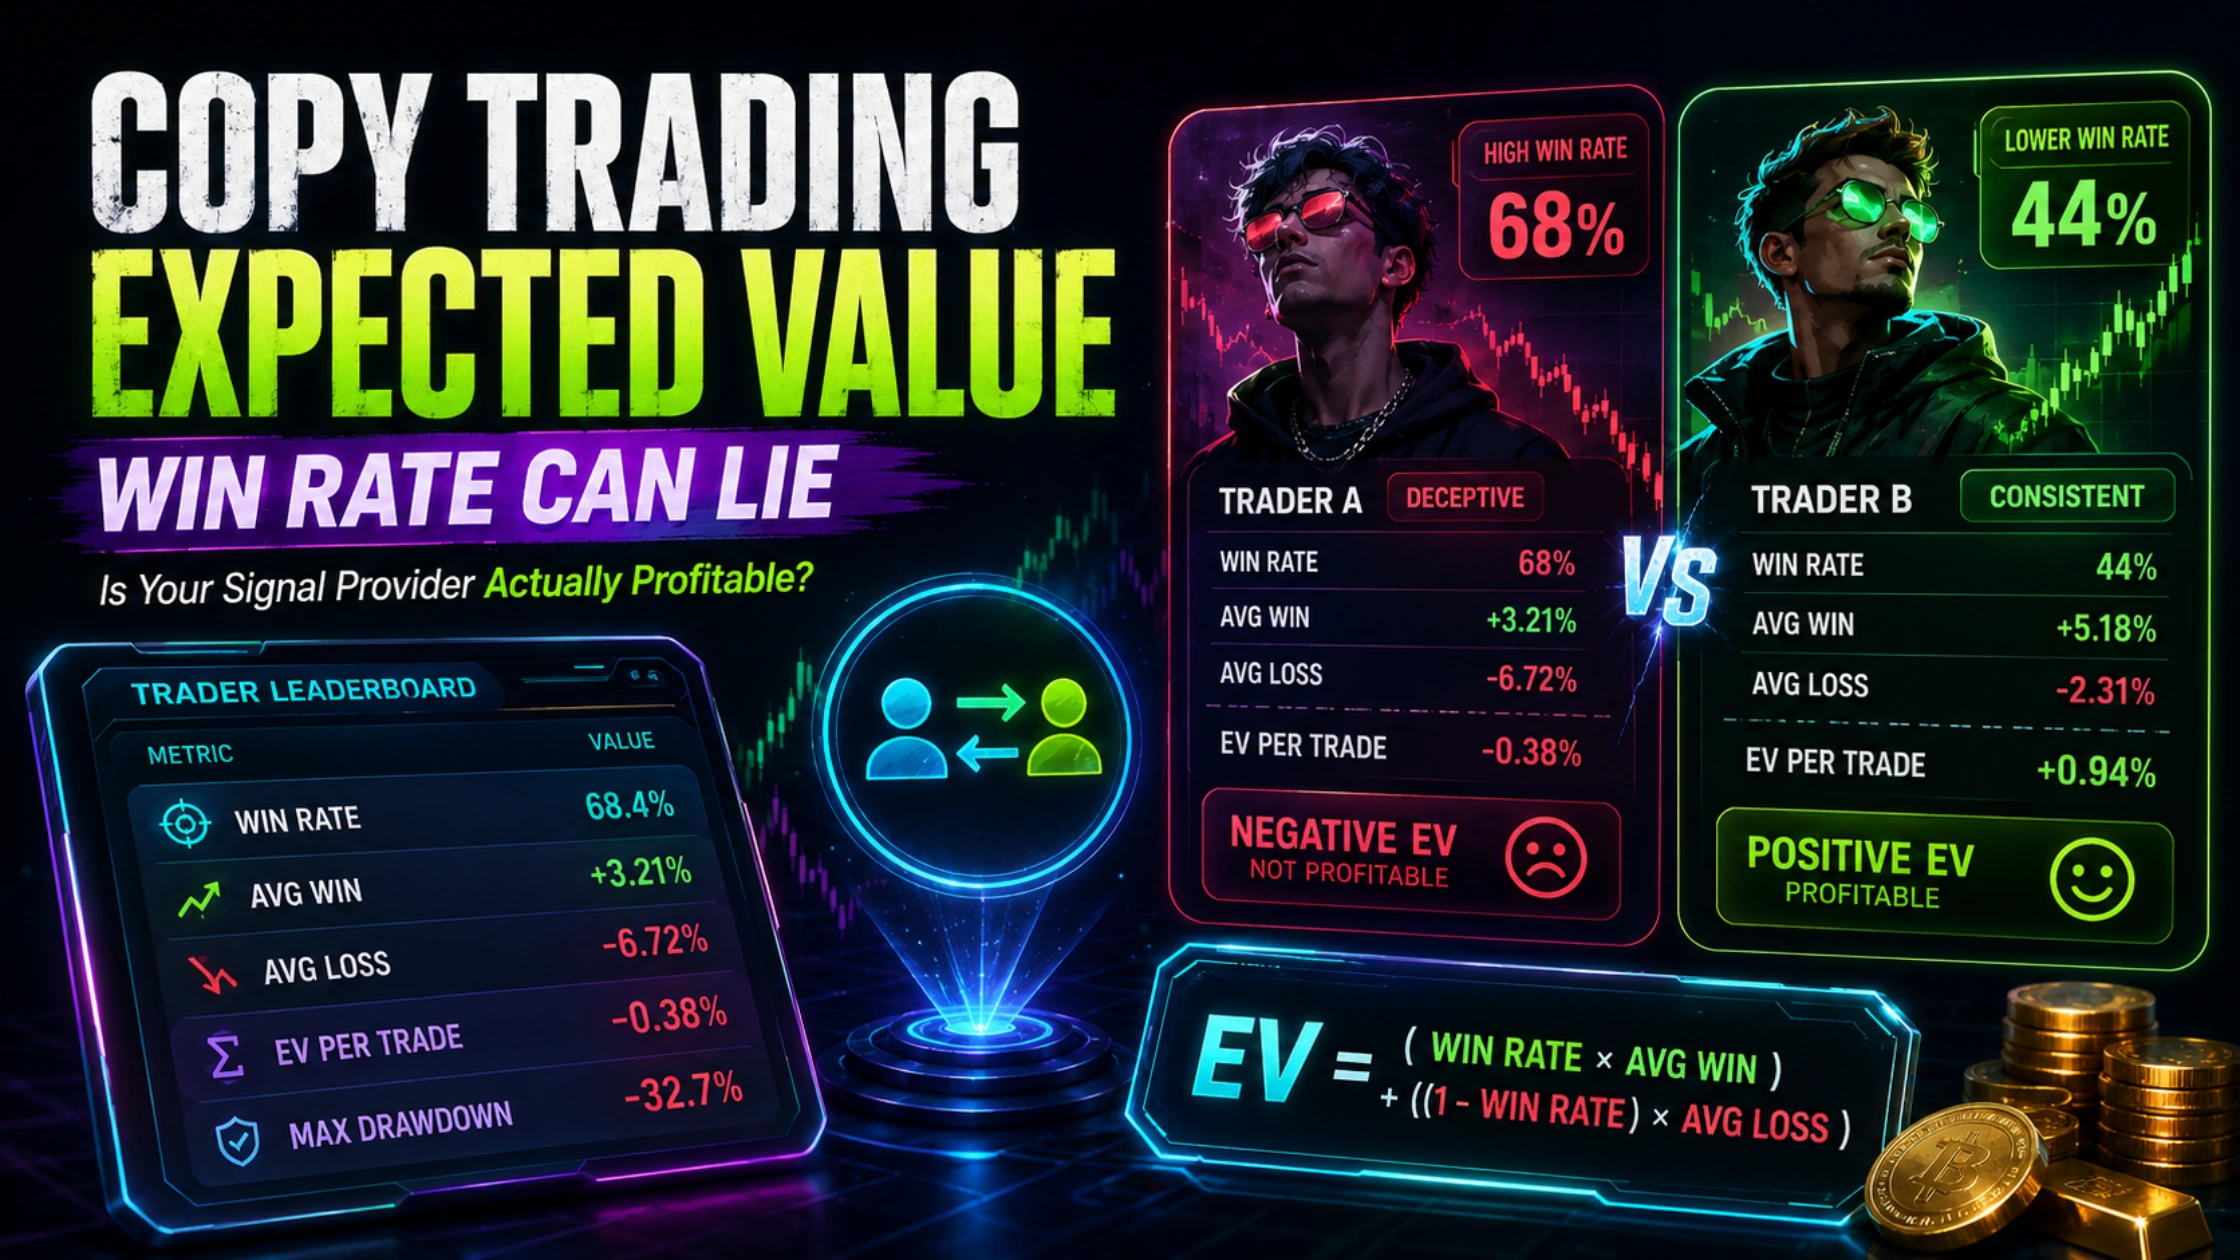
A 60% win rate sounds impressive until you discover it is based on 47 trades. This calculator shows whether your copy trader’s edge is real or luck, and the minimum track record required to know the difference.
Copy Trading Expected Value Calculator 2026 — Is Your Signal Provider Actually Worth Following?
Expected value is the only number that determines whether a copy trader makes you money long-term. A trader with a 70% win rate but tiny average wins and large average losses has negative expected value, and you will lose money following them regardless of how impressive the win rate looks. The calculator below computes EV per trade, monthly return, profit-sharing drag, streak probabilities, and the minimum track record needed to know whether any of those numbers are real.
The Copy Trading Promise
The marketing pitch for copy trading is compelling and straightforward: find a profitable trader, allocate capital to automatically mirror their positions, and earn while they do the work. The platforms are beautifully designed for exactly this narrative. Bybit’s leaderboard shows traders ranked by return percentage. OKX’s Lead Trader programme surfaces high-performing signal providers with detailed statistics. Bitget’s copy trading suite offers one-click follower activation.
The problem is not the platforms. The problem is how most people interpret what they see on leaderboards, and how little the numbers displayed correspond to the questions that actually matter.
A trader displaying 847% returns on Bybit’s leaderboard is reporting a real number. What that number does not tell you: whether that return was achieved on a $300 account or $300,000. Whether it represents one year of consistent performance or three weeks of extreme leverage during a trending market. Whether the win rate is 80% because the trader is skilled or because they are running a strategy that wins often and catastrophically loses occasionally. Whether the 47 trades shown are enough data to conclude anything at all.
The copy trading industry’s fundamental tension sits between marketing, which benefits from displaying impressive numbers, and statistical reality, which requires significantly more data than most leaderboards accumulate before traders are promoted to top positions. The calculator below is designed to resolve that tension on behalf of the follower.

The Leaderboard Illusion — Survivorship Bias at Scale
Before examining individual trader statistics, there is a structural problem with every copy trading leaderboard that the platforms do not advertise.
Thousands of traders register on each platform. Most lose money, particularly in the early months. The ones that lose money quietly disappear from leaderboards, either by stopping trading, reducing activity, or having their accounts fall below thresholds for visible ranking. The ones that have a profitable period, even briefly, rise to visible positions. The leaderboard at any given moment shows only the traders who have survived to that point, creating a pool that looks systematically better than the underlying population of all traders the platform hosts.
This is survivorship bias operating at full scale. If you flipped a coin 1,000 times and showed only the people who got 60% or more heads in their first 50 flips, the surviving group would look like skilled coin-flippers. They are not. They are the lucky ones from a large initial population.
This does not mean every trader on a leaderboard is lucky. Some are genuinely skilled. The challenge is that the leaderboard display makes it extremely difficult to distinguish skill from luck in the time periods shown, because most traders have not generated enough trades for the distinction to be statistically meaningful.
The track record output in the calculator below quantifies this exactly.

Expected Value — The Only Number That Matters Long-Term
Win rate alone is meaningless. A trader who wins 80% of the time but makes 0.5% on wins and loses 3% on losses has an expected value of:
EV = (0.80 × 0.5%) − (0.20 × 3%) = 0.40% − 0.60% = −0.20% per trade
This trader will destroy your capital with mathematical certainty over enough trades, despite winning 80% of the time.
Conversely, a trader who wins only 40% of the time but averages 4% on wins and 1.5% on losses has:
EV = (0.40 × 4%) − (0.60 × 1.5%) = 1.60% − 0.90% = +0.70% per trade
This trader generates positive expected value even while losing 60% of individual trades.
The formula is always the same:
EV = (Win rate × Average win%) − (Loss rate × Average loss%)
Positive EV is necessary for a strategy to be profitable in the long run. It is not sufficient. You also need enough capital to withstand the losing streaks that occur even in positive EV strategies, and you need the win/loss sizes to remain consistent. But negative EV is sufficient to guarantee long-term losses, regardless of any other feature of the strategy.
The break-even win rate, the minimum win rate at which a strategy is not losing money, depends entirely on the ratio of average wins to average losses:
Break-even win rate = Average loss / (Average win + Average loss)
A strategy where wins average 1.5% and losses average 1.0% needs a win rate above 40% to break even. A strategy where wins and losses are equal in size needs a win rate above 50%. A strategy where losses average twice the wins needs a win rate above 66.7% just to break even.
Most traders and most copy trading followers do not calculate this. They see a high win rate and interpret it as quality without checking whether the win/loss ratio supports that interpretation.
The Track Record Problem — When 60 Days Is Worthless Data
Here is the counterintuitive insight that the calculator quantifies and that no copy trading platform explains clearly.
A trader showing a 65% win rate over 45 trades, roughly 30 to 45 days of active trading, has produced a data set that is statistically insufficient to conclude they have any edge at all. At 95% confidence, the true win rate for this trader could be anywhere from 51% to 79%. The range of uncertainty is so wide that you cannot distinguish a genuinely skilled trader from someone on a lucky run.
The mathematics of statistical significance for a win rate requires:
Minimum trades (95% confidence) = (1.96² × p × (1−p)) / (p − 0.50)²
Where p is the stated win rate. For a 65% win rate the formula gives approximately 39 trades to distinguish the performance from a 50% coin flip. But the real question is not whether the win rate is above 50%. It is whether the win rate is high enough to generate positive expected value given the trader’s win/loss size ratio.
For a trader claiming 55% win rate, common on most leaderboards, with equal win and loss sizes, you need 95% confidence that the win rate is genuinely above 50%:
Minimum trades = 3.8416 × 0.55 × 0.45 / (0.05)² = 381 trades
At 30 trades per month that is nearly 13 months of trading history. Most promoted leaderboard traders have 30 to 90 days of data. The calculator shows exactly how many trades your specific signal provider needs before their statistics carry statistical weight.

The Profit-Sharing Drag Nobody Calculates
Copy trading platforms take a profit-sharing cut ranging from 5% to 20% of profits generated for followers. This sounds modest. Compounded over a year, it is not.
Consider a signal provider generating 8% monthly gross return on a $10,000 account. Over 12 months that compounds to approximately 152% gross return, producing $15,200 in profit. At 10% profit sharing, the platform and trader take $1,520. Net return: $13,680, or 136.8%.
The difference between 152% and 136.8% is not dramatic in isolation. But the profit-sharing drag compounds differently from your capital. It is taken out of the portfolio’s growth as it occurs, permanently reducing the capital base that future compounding acts on. At higher profit-sharing rates of 15 to 20%, or over longer periods, this compounds to a meaningful reduction in actual returns.
The calculator below shows the dollar value of profit-sharing drag in monthly and annual terms, making the actual cost of following any signal provider transparent before you commit capital.
Losing Streak Probability — Even Good Traders Look Bad
The probability of a losing streak is not a question of whether the trader is good or bad. It is a mathematical certainty that emerges from the win rate and number of trades.
For a trader with a 65% win rate, losing 35% of trades, the probability of any three consecutive losses starting at a specific trade is:
P(3 consecutive losses) = 0.35³ = 4.3%
Over 100 trades, the expected number of points at which a 3-loss streak begins is approximately 98 × 0.043, giving roughly 4.2 streaks expected. A trader with a genuine 65% win rate will experience multiple 3-trade losing runs in any 100-trade sample. Followers who stop copying after a 3-trade losing streak are not responding to evidence of the strategy failing. They are responding to noise.
For 5 consecutive losses: P = 0.35⁵ = 0.5% per specific starting point. In 100 trades, approximately 0.48 expected occurrences, less than one but possible.
The practical implication: if you are going to copy a trader, you need to decide on your evaluation criteria before you start, not reactively during a losing streak. The calculator shows the probability of various losing streak lengths so you can calibrate your expectations against reality before any real money is at stake.
Use the Calculator
Enter your signal provider’s stated statistics to see whether the numbers support following them.

Reading the Output — What Each Number Tells You
Expected value per trade. The single most important output. Positive EV confirms the strategy is theoretically profitable. Negative EV means the strategy loses money on average regardless of short-term performance. Any signal provider with negative EV should be rejected immediately regardless of their leaderboard ranking.
Break-even win rate. The win rate the trader needs just to avoid losing money given their stated win/loss sizes. If the stated win rate is close to the break-even rate, a small statistical uncertainty in the track record data could mean the true win rate falls below break-even.
Monthly and annual expected return. Based on EV per trade and trading frequency, this shows the theoretical return if the strategy performs at the stated parameters consistently. This is a ceiling, not a forecast. Real returns are lower due to execution slippage on copy trades, periods of reduced activity, and statistical variance.
Profit-sharing drag. The dollar cost of the performance fee structure at the expected return level. Compare this to the value you could generate running a simpler strategy independently.
Streak probabilities. How often to expect losing streaks of 3, 5, and 7 trades. Use this to calibrate your patience. If the calculator shows a 5-trade losing streak is expected every 200 trades, experiencing one is not a reason to stop copying.
Minimum track record for statistical significance. The number of trades required before the stated win rate can be trusted at 90% and 95% confidence. If the signal provider has fewer trades than this threshold, their statistics are not yet meaningful regardless of how impressive the percentage returns look.
The Three Platforms and What to Look For
Bybit Copy Trading is the most liquid retail copy trading product globally. The lead trader leaderboard is sortable by AUM under management, profit percentage, win rate, maximum drawdown, and follower count. The key filter to apply before running any trader through the calculator: sort by Total Trades and filter for traders with more than 200 completed trades. This immediately eliminates the majority of leaderboard entries and leaves only those with sufficient track records to analyse meaningfully. Bybit’s profit-sharing rates typically range from 5% to 10% for established lead traders.
OKX Lead Trader provides one of the more transparent data displays among major platforms, showing drawdown history alongside returns. This detail matters: a trader generating 8% monthly at 40% maximum drawdown is taking risk levels that most followers cannot sustain emotionally or financially. OKX’s lead trader interface shows the maximum drawdown the trader has experienced, context that most platforms obscure. Profit-sharing rates run up to 15%.
Bitget Copy Trading has invested heavily in its copy trading product, with copy trader discovery filters including PnL, win rate, follower count, and trading style covering scalping, swing, and trend following. Bitget’s Elite Traders programme applies a vetting process before traders are featured, which provides some quality filtering. This vetting is not equivalent to statistical significance testing, but it does eliminate the worst-performing outliers from prominent placement. Bitget’s profit-sharing framework runs at 8 to 12% for most featured traders.
Red Flags That Should End the Evaluation Before the Calculator
Some signal providers can be ruled out before running their statistics through any tool. The following patterns are categorical disqualifiers.
A track record below 90 days with fewer than 100 trades. There is no statistically meaningful data to evaluate. The trader may be excellent or may be lucky, and the data cannot distinguish between the two.
Win rates above 85% with small average wins. This pattern is the signature of a martingale or averaging-down strategy. The trader wins frequently by adding to losing positions and eventually closing everything at a small profit, while hiding the accumulating unrealised loss. The strategy eventually results in a catastrophic liquidation that eliminates weeks or months of prior gains. Look for this pattern in the maximum drawdown figure: a 90% win rate trader with a maximum drawdown of 45% has been running a strategy that was one bad trade away from catastrophe.
Return percentages achieved on very small account sizes. A 2,000% return on a $200 account is mathematically equivalent to $4,000 of profit. The same percentage on a $50,000 account would be $1,000,000 in profit, something that does not exist on any retail copy trading leaderboard. High percentage returns on small accounts are marketing artifacts, not evidence of institutional-grade strategy performance.
No disclosure of the risk settings or leverage used. Expected value calculations using percentage win and loss sizes are only meaningful if the position sizing is consistent. A trader who achieves a 65% win rate by varying position size, large on high-conviction trades and small on others, may be reporting statistics that look better than the strategy’s actual risk-adjusted performance.
FAQ
What is expected value in copy trading? Expected value is the average outcome per trade when the win rate and average win/loss sizes are known. It is calculated as: (win rate × average win percentage) minus (loss rate × average loss percentage). A positive expected value means the strategy earns money on average over many trades. A negative expected value means it loses money on average, regardless of how the win rate appears in isolation.
How many trades does a copy trader need before their statistics are reliable? It depends on their win rate. A trader claiming 55% win rate needs approximately 380 trades before their statistics can be trusted at 95% confidence. A trader claiming 65% needs approximately 92 trades. Most leaderboard traders have fewer than 100 trades. The calculator shows the exact number for any stated win rate.
What is a good profit-sharing rate for copy trading? Below 10% is reasonable for access to a genuinely skilled trader with a substantial verified track record. Above 15% requires exceptional performance evidence to justify because the compounding effect of the profit share erodes returns meaningfully over 12 or more months. Avoid any arrangement where the profit-sharing rate is not disclosed upfront.
Can a copy trader with a low win rate still be worth following? Yes. Win rate alone does not determine whether a strategy is profitable. A trader with a 40% win rate but an average win 3 times larger than their average loss has positive expected value and a break-even win rate of 25%. The ratio of win size to loss size matters as much as the win rate. The calculator evaluates both simultaneously.
What is survivorship bias in copy trading leaderboards? Survivorship bias occurs when only successful traders remain visible on leaderboards while unsuccessful traders disappear through account closure, reduced activity, or falling below ranking thresholds. This makes the visible pool of leaderboard traders appear systematically better than the full population of traders on the platform. It means leaderboard rankings over-represent luck relative to skill, particularly over short time periods.
Is copy trading profitable in 2026? Copy trading can be profitable when applied with statistical discipline: evaluating signal providers by expected value rather than win rate, requiring statistically significant track records before allocating capital, and sizing the copy allocation to withstand losing streaks without being forced to withdraw. Applied casually, chasing leaderboard returns without analytical evaluation, it is not reliably profitable for followers.
Evaluate and copy trade: Bybit Copy Trading — filter by total trades for track record depth · OKX Lead Trader — drawdown history visible alongside returns · Bitget Copy Trading — Elite Traders programme with vetting

Start Here — Build Your Crypto Infrastructure Safely
You don’t need to use everything at once.
Professionals reduce risk by having access to multiple rails so they are never dependent on a single platform.
Below is a simple, practical setup used by many experienced traders and investors.
1) Your Fiat Gateway (Primary Access)
Best starting point for deposits & withdrawals
Binance — reliable onboarding, deep liquidity, global coverage
👉 sign up
Why open this:
- Move from bank → crypto easily
- Convert large amounts efficiently
- Emergency exit capability

2) Your Trading Execution Venue (Fast & Flexible)
Best for active trading and broad market access
MEXC — huge altcoin selection & low trading friction
👉 sign up
Why open this:
- Trade markets not listed elsewhere
- Better execution during volatility
- Lower dependence on a single exchange
3) Your Advanced Tools & Derivatives Platform
Best for leverage, hedging and professional execution
Bybit — strong order controls & derivatives infrastructure
👉 sign up
Why open this:
- Proper stop loss tools
- Hedging capability
- Strategy flexibility

4) Your Yield & Passive Income Layer
Best for structured products and capital efficiency
Gate.com — structured yield & automated earning tools
👉 sign up
Why open this:
- Earn on idle capital
- Diversify platform risk
- Access structured strategies
5) Your Altcoin & Ecosystem Expansion Layer
Best for early market access and wide listings
KuCoin — broad token ecosystem
👉 sign up
Why open this:
- Access emerging markets
- Portfolio diversification
- Redundancy if one platform restricts access
Why This Structure Matters
Using one exchange creates a single point of failure.
Using multiple rails creates:
- Liquidity redundancy
- Faster reaction ability
- Lower operational risk
- Greater opportunity access
You don’t need large capital to start — you just need prepared infrastructure.
Practical Next Step
Open accounts gradually and verify them before you need them.
Most people only prepare during stress —
professionals prepare before it.
(Decentralised News provides infrastructure education, not financial advice. Always use proper security practices.)
Recommended reading:
7 Copy Trading Mistakes Beginners Make (And How to Avoid Them)
About the Author