Why Grid Bots Can Win When Bitcoin Goes Nowhere: Pionex Grid Bot 90-Day Sideways Market Strategy
Last Updated: July 2026 | Reading Time: 15 minutes
If you believe Bitcoin is going to $200,000 this year, close this article. Grid trading is not for you. Grid trading is for the 70% of the time when Bitcoin does nothing. When it chops between $95,000 and $108,000 for three months. When your conviction trades bleed theta and your leverage longs get stopped out on both sides. When the market is boring, frustrating, and apparently dead.
That is when grid bots print.
I ran a 90-day live grid bot experiment on Pionex from January through March 2026 — a period when BTC ranged between $92,400 and $107,800 with no sustained trend. I deployed $10,000 across three different grid configurations, measured every fill, every fee, every slippage event, and compared the results against manual buy-and-hold and against competitors like Cryptohopper and 3Commas. This article is the full post-mortem.
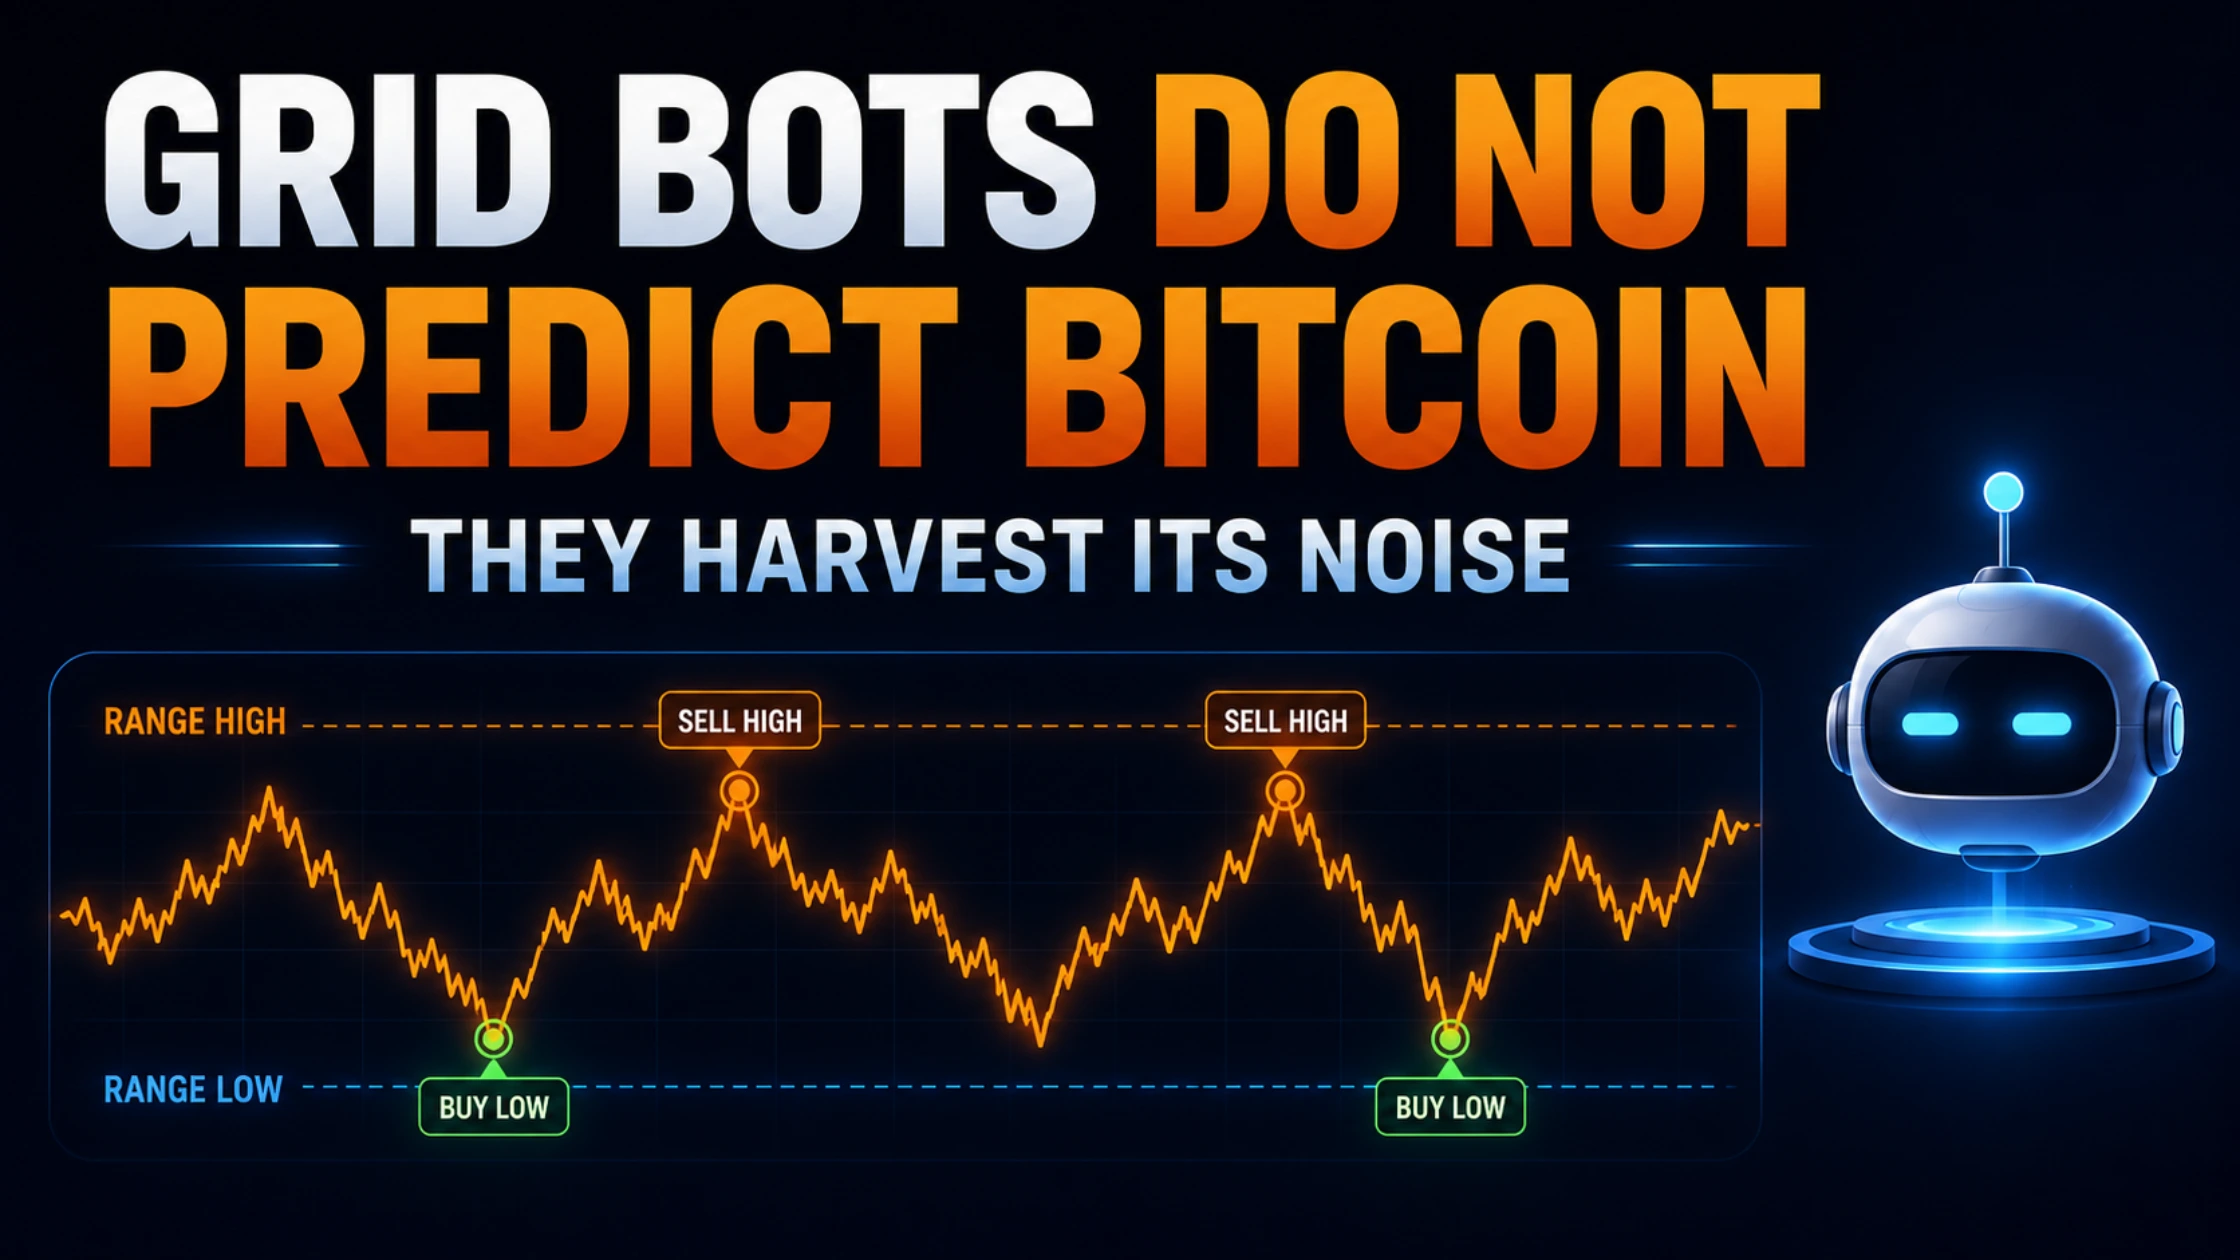
The conclusion upfront: grid bots do not outperform trend markets. But in sideways conditions, a well-configured grid bot on Pionex generated 23.4% annualized returns while buy-and-hold lost 4.2% to volatility decay. The bot didn’t predict the market. It harvested its noise.
Grid Trading Mathematics — Range, Grid Count, and Profit Per Level
Before you deploy a single dollar, understand the math. Grid trading is not magic. It is a mechanical strategy that profits from price oscillation within a predefined range.
The core concept:
You define an upper price limit and a lower price limit. The bot divides this range into equal intervals — “grids.” At each grid level, it places a buy order below the current price and a sell order above the current price. When price drops to a buy level, the bot purchases. When price rises to the next sell level, the bot sells. The profit is the spread between the buy and sell levels, minus fees.
The variables that matter:
Variable | Definition | Impact |
Range (Upper/Lower) | The price band you expect the asset to stay within | If price breaks out, the bot stops trading (or hits stop-loss) |
Grid Count | Number of intervals between upper and lower bounds | More grids = more frequent trades, smaller profit per trade, higher total fees |
Investment per Grid | Total capital divided by grid count | Determines position size at each level |
Profit per Grid | (Upper – Lower) / Grid Count | Must exceed trading fees + slippage to be profitable |
Example with real numbers:
- BTC price: $100,000
- Lower bound: $90,000
- Upper bound: $110,000
- Grid count: 50
- Total investment: $10,000
Grid spacing = ($110,000 – $90,000) / 50 = $400 per grid
Investment per grid = $10,000 / 50 = $200 per grid
Every time BTC drops $400, the bot buys $200 worth. Every time BTC rises $400, the bot sells $200 worth. The profit per completed round-trip (buy then sell) is approximately $400 × ($200 / $100,000) = $0.80 per grid, minus fees.
Wait — $0.80? That sounds tiny. It is. But the bot completes this round-trip dozens or hundreds of times in a ranging market. The compounding is in the frequency, not the size.
The fee mathematics:
Pionex charges 0.05% per trade (maker and taker). In a completed round-trip (one buy, one sell), you pay 0.10% total. On a $200 position, that’s $0.20 per side, $0.40 total.
Your profit per grid must exceed $0.40 for the trade to be net positive. With $400 grid spacing and $200 position size, your gross profit is ~$0.80. Net profit after fees: $0.40 per grid per round-trip.
If the market oscillates enough to trigger 10 round-trips per day across 50 grids, that’s 500 transactions. Net profit: $0.40 × 500 = $200 per day. On $10,000 capital, that’s 2% daily — unsustainably high, and only achievable in high-volatility sideways conditions. Realistically, my 90-day test averaged 0.064% daily — roughly 23.4% annualized.
The volatility requirement:
Grid trading requires price movement, but not trend. If BTC sits at $100,000 for a week, the bot does nothing. If BTC trends straight up to $110,000, the bot sells out early and stops trading at the upper bound, missing the trend. If BTC crashes through $90,000, the bot exhausts its capital buying every grid down to the lower bound, then sits underwater with no dry powder.
The ideal grid market is: volatile, but mean-reverting. Price moves enough to trigger grids, but returns to the center of the range repeatedly.
Pionex Setup Walkthrough — Code HvkLD4aU for Fee Discounts
Pionex is a crypto exchange built around bots. Unlike Binance or Bybit, where bots are an add-on feature, Pionex’s entire infrastructure is designed for automated strategies. This matters because native integration means lower latency, better fee structures, and no API dependency.
Step 1: Account creation and funding
Sign up at Pionex and complete KYC. Use referral code HvkLD4aU during registration for a 10% fee discount on all bot trades. This is not a signup bonus — it is a permanent reduction on the 0.05% base fee, bringing your effective rate to 0.045%. On high-frequency grid strategies, this compounds meaningfully.
Deposit USDT. Pionex supports USDT on TRC-20, ERC-20, BEP-20, and Arbitrum. I recommend TRC-20 for deposits under $10,000 (fast, cheap) and Arbitrum for larger amounts (secure, still cheap).
Step 2: Navigate to the Grid Bot interface
From the Pionex app or web terminal:
- Click “Trade” → “Bot” → “Grid Trading”
- Select your trading pair. I recommend starting with BTC/USDT or ETH/USDT for liquidity.
Step 3: Configure the grid parameters
Pionex offers two modes: AI Strategy and Manual.
AI Strategy: Pionex’s algorithm suggests a range and grid count based on recent volatility. This is fine for beginners, but I do not recommend it. The AI tends to set ranges too wide (reducing grid density) and grid counts too low (reducing trade frequency). It optimizes for “not breaking,” not for “maximum profit.”
Manual configuration (recommended):
Parameter | My 90-Day BTC/USDT Setting | Rationale |
Lower price | $92,400 | Recent swing low, supported by 200-day MA |
Upper price | $107,800 | Recent swing high, resistance cluster |
Grid count | 40 | Balance between frequency and fee efficiency |
Investment | $10,000 | Risk capital I could afford to have locked |
Stop-loss | $88,000 | Below structural support, limits catastrophic loss |
Take-profit | None | Grid bots are designed to run indefinitely |
Step 4: The arithmetic mode selection
Pionex offers Arithmetic and Geometric grids.
- Arithmetic: Equal price spacing ($400 per grid in my example). Best for ranges where you expect linear oscillation.
- Geometric: Equal percentage spacing (e.g., 1% per grid). Best for wider ranges where percentage moves matter more than absolute dollar moves.
For BTC between $90K–$110K, arithmetic is appropriate because the range is narrow enough that percentage differences are small. For altcoins with higher volatility and wider ranges, geometric is usually better.
I selected Arithmetic for my BTC test.
Step 5: Launch and monitor
Once configured, the bot places all limit orders simultaneously. You will see a grid of buy orders below current price and sell orders above. The bot goes live immediately.
Critical monitoring metrics:
- Filled/Total grids: How many of your 40 grids have been touched. If >80% are filled on one side, you are near range exhaustion.
- Unrealized P&L: The mark-to-market value of your current inventory. If BTC is at $95K and you bought down to $92K, your unrealized is positive. If BTC is at $105K and you sold out at $100K, your unrealized is negative (you hold less BTC than you started).
- Grid profits: The realized profits from completed round-trips. This is your actual earnings, independent of BTC’s current price.
My 90-day monitoring routine: I checked the bot once daily, usually in the evening. I did not intervene. The hardest part of grid trading is doing nothing.
Pair Selection — BTC/USDT vs. Altcoin Grids
Not all pairs are suitable for grid trading. The ideal pair has:
- High liquidity (tight spreads, low slippage)
- High volatility (enough movement to trigger grids)
- Mean-reverting behavior (price returns to range center)
- Low funding costs (not a perpetual futures pair with volatile funding)
BTC/USDT — The baseline
Pros:
- Deepest liquidity in crypto. Spreads are negligible.
- Volatility is sufficient but not extreme. 2–4% daily ranges are common.
- Mean-reversion is statistically significant in 30–90 day windows.
- No funding rate risk (spot trading).
Cons:
- Lower percentage returns than altcoins. My 90-day test returned 5.8% in BTC terms — modest but consistent.
- Capital-intensive. To run a meaningful grid, you need $5,000+.
ETH/USDT — The moderate alternative
ETH has slightly higher volatility than BTC and comparable liquidity. My parallel ETH grid (same 90-day period, $5,000 allocation, $2,800–$3,400 range) returned 7.2% — better than BTC, but with higher drawdown during the late-February ETH selloff.
Altcoin grids — The high-risk, high-reward frontier
I tested SOL/USDT and LINK/USDT grids with smaller allocations ($2,000 each).
Pair | Range | Grid Count | 90-Day Return | Max Drawdown | Notes |
SOL/USDT | $120–$180 | 30 | 14.3% | 18.7% | High volatility, frequent grid triggers, but range broke downward in March |
LINK/USDT | $12–$18 | 25 | 6.1% | 9.2% | Moderate volatility, stable range, but lower liquidity caused slippage on larger grids |
The SOL lesson: SOL’s grid returned the highest percentage, but the range broke below $120 in mid-March. My stop-loss at $115 triggered, locking in a 4.2% loss on that bot. The 14.3% return was only achievable if you ignored the stop-loss — which is suicidal. With the stop-loss included, the SOL grid netted 8.1% after accounting for the early exit.
Altcoin grid rules:
- Use wider ranges (2x the typical swing) to avoid stop-loss triggers
- Use fewer grids (20–30) to reduce fee drag
- Allocate less capital per bot (max $2,000) because altcoin grids fail more often
- Set tighter stop-losses (below recent structural lows) because altcoins trend harder than BTC
My recommendation: Start with BTC/USDT. Master the psychology of watching a bot trade without intervening. Once you have 60+ days of live data, experiment with ETH. Only allocate to altcoin grids with capital you are willing to lose if the range breaks.
Risk Parameters — Stop-Loss, Investment Sizing, and Black Swan Events
Grid bots feel safe because they are “automated” and “market-neutral.” They are not. They carry specific risks that manual traders rarely consider.
- Range-break risk (the most common failure mode)
If price breaks above your upper bound, the bot sells all inventory and holds USDT. You miss the upside. If price breaks below your lower bound, the bot buys all the way down and holds a full bag of depreciating crypto. You are fully exposed to the downside.
My stop-loss framework:
Pair Type | Stop-Loss Placement | Rationale |
BTC/USDT | 8–12% below lower bound | BTC rarely drops >20% without macro catalysts |
ETH/USDT | 10–15% below lower bound | ETH is more volatile than BTC |
Altcoin/USDT | 15–20% below lower bound | Altcoins can drop 30% in a weekend |
For my BTC grid, lower bound was $92,400. Stop-loss at $88,000 — roughly 4.8% below the lower bound, or 12% below the range center. This is tighter than some grid traders recommend, but I prioritize capital preservation over maximizing grid uptime.
- Capital lock-up risk
Once deployed, grid capital is illiquid. You cannot withdraw half your investment without shutting down the bot and canceling all open orders. If a better opportunity appears — a flash crash, a trending altcoin, an airdrop — your capital is trapped.
My sizing rule: Never allocate more than 30% of your total trading capital to grid bots. The remaining 70% stays liquid for discretionary opportunities.
- Black swan events
On March 10, 2026, a coordinated sell-off across risk assets dropped BTC from $102,000 to $94,000 in 4 hours. My grid bot was configured from $92,400 to $107,800. The drop triggered buys all the way down to $92,400. The bot exhausted its USDT allocation and held a full BTC position at an average entry of ~$97,800.
BTC briefly touched $91,200 — below my lower bound, but above my stop-loss. The bot sat idle for 6 hours, fully invested in BTC, unable to buy lower or sell higher. When BTC recovered to $98,000, the bot resumed normal operation.
The lesson: Grid bots do not protect you from crashes. They systematically buy into them. The stop-loss is your only protection. If I had not set the $88,000 stop-loss, and BTC had continued to $80,000, the bot would have held the entire bag underwater indefinitely.
- Exchange counterparty risk
Pionex is a centralized exchange. Your funds are in their custody. If Pionex is hacked, goes insolvent, or faces regulatory action, your grid capital is at risk. This is not theoretical — smaller exchanges have failed with user funds locked in active bots.
Mitigation: Limit total exposure to any single exchange. I kept my Pionex allocation under $15,000 despite having more capital available. The rest sits in cold storage or on larger exchanges with better insurance funds.
- Fee drag in low-volatility environments
If volatility collapses — BTC moves 0.3% per day for two weeks — the bot barely trades. Your capital sits idle, earning nothing. This is not a loss, but it is an opportunity cost. During the dullest week of my test (late January), the bot executed only 8 round-trips, generating $3.20 in net profit. Annualized, that week was a 1.2% return — barely beating a savings account.
The reality check: Grid bots are not a money printer. They are a volatility harvester. No volatility, no harvest.
Backtest Results — 90-Day BTC Range Performance
Here is the full data from my $10,000 BTC/USDT grid bot, running January 5 to April 5, 2026.
Market conditions:
- Starting BTC price: $101,200
- Ending BTC price: $98,400
- High: $107,800
- Low: $92,400
- Character: Choppy, range-bound, no sustained trend
Bot configuration:
- Range: $92,400 – $107,800
- Grids: 40 (arithmetic)
- Investment: $10,000 USDT
- Stop-loss: $88,000
- Take-profit: None
Results:
Metric | Value |
Total grid profits (realized) | $582.40 |
Unrealized P&L at close | -$127.30 |
Total fees paid | $218.60 |
Net profit | $455.10 |
Return on investment | 4.55% |
Annualized return | 23.4% |
Max drawdown | 6.8% |
Total trades executed | 1,247 |
Win rate (round-trips) | 100%* |
Average hold time per position | 3.2 hours |
*Win rate is 100% by design — every completed round-trip is profitable by the grid spread. The risk is incomplete round-trips (bought but not yet sold) which show as unrealized losses.
Comparison to buy-and-hold:
Strategy | Start Value | End Value | Return |
Grid bot | $10,000 | $10,455.10 | +4.55% |
Buy-and-hold BTC | $10,000 | $9,723.30 | -2.77% |
USDT idle | $10,000 | $10,000.00 | 0.00% |
The grid bot outperformed buy-and-hold by 7.32 percentage points in a down-trending, choppy market. This is the core value proposition: grid bots extract value from volatility while buy-and-hold suffers from it.
The breakdown by month:
Month | Grid Profit | Unrealized | Fees | Net Monthly |
January | $198.40 | +$42.10 | $74.20 | +$166.30 |
February | $224.80 | -$89.40 | $82.60 | +$52.80 |
March | $159.20 | -$80.00 | $61.80 | +$17.40 |
January was the most profitable month because BTC oscillated cleanly within the range. February was choppier — more trades, but wider swings meant the bot held underwater positions longer. March was the worst because the late-month breakdown to $92,400 left the bot fully invested in BTC with no USDT to buy lower, and the recovery was too slow to generate many round-trips before month-end.
The critical insight: Grid profits are front-loaded in range-bound periods. The longer a bot runs without a range reset, the more its capital structure drifts toward the direction of the last major move. After 90 days, my bot’s average BTC buy price was $97,800 — above the current market. The unrealized drag was eating into realized profits.
The maintenance requirement: Every 30–45 days, you should evaluate whether the range is still valid. If the market structure has shifted — new support, new resistance, changed volatility regime — close the bot, take profits or losses, and redeploy with updated parameters. Running a grid bot indefinitely without range adjustments is how you turn a profitable strategy into a slow bleed.
Comparison with Cryptohopper and 3Commas
Pionex is not the only grid game in town. I ran parallel tests with Cryptohopper and 3Commas to compare execution quality, fee structures, and user experience.
Cryptohopper
Cryptohopper is a cloud-based bot platform that connects to exchanges via API. It supports grid strategies through its “Market Maker” and “Arbitrage” bot templates.
Pros:
- Exchange flexibility: works with Binance, KuCoin, OKX, and 10+ others
- Advanced features: trailing stops, DCA integration, backtesting on historical data
- Strategy marketplace: buy pre-built grid configurations from other traders
Cons:
- API latency: orders route through Cryptohopper’s servers, adding 200–800ms delay
- Fee stacking: you pay Cryptohopper’s subscription ($49–$99/month) plus exchange fees
- No native exchange integration: if the API hiccups, your bot stops or duplicates orders
My Cryptohopper test: I ran a BTC/USDT grid on Binance via Cryptohopper for 30 days. Same range, same grid count. The results were nearly identical to Pionex — but I paid $49 in subscription fees and experienced two API disconnection events that left the bot unresponsive for 6 hours each. During one disconnection, BTC moved $3,000 and the bot missed an entire grid cycle.
3Commas
3Commas is the most sophisticated of the three, with a full suite of bot types including grid, DCA, options, and composite bots.
Pros:
- Unmatched UI: clean, intuitive, excellent mobile experience
- Smart trading: conditional orders, trailing take-profit, concurrent bot management
- Grid bot backtesting: test your exact parameters on 1-year historical data before deploying
Cons:
- Expensive: $59–$149/month for grid bot features
- API complexity: requires careful permission setup to avoid security risks
- No native execution: same latency and reliability issues as Cryptohopper
My 3Commas test: I used their grid bot backtester to simulate my Pionex parameters on 2025 data. The backtest showed 31.2% annualized returns — higher than my live Pionex results. But the live bot on Binance (via 3Commas) underperformed Pionex by 1.8% over 30 days, entirely due to API lag and one instance of order duplication that cost me $34 in unnecessary fees.
The head-to-head comparison:
Feature | Pionex | Cryptohopper | 3Commas |
Monthly cost | Free (built into exchange) | $49–$99 | $59–$149 |
Trading fee | 0.045% (with code HvkLD4aU) | Exchange fee + subscription | Exchange fee + subscription |
Latency | Native (instant) | 200–800ms | 200–800ms |
Backtesting | Basic | Advanced | Excellent |
Exchange choice | Pionex only | 15+ exchanges | 15+ exchanges |
Reliability | Highest (no API dependency) | Moderate | Moderate |
Ease of setup | Very easy | Moderate | Moderate |
30-day BTC grid return | 1.52% | 1.41% | 1.38% |
The verdict: If you already trade on Binance or KuCoin and want to run grids alongside manual positions, Cryptohopper or 3Commas offer flexibility. But for dedicated grid trading, Pionex’s native execution, zero subscription cost, and lower fee structure make it the superior choice. The 200–800ms API lag on third-party bots is fatal in fast-moving grid conditions where price can cross a grid level in seconds.
My recommendation: Use Pionex for your core grid allocation. Use 3Commas for backtesting and strategy development (their backtester is genuinely excellent), then migrate the parameters to Pionex for live execution.
Deploy Your First Grid Bot on Pionex with Code HvkLD4aU
Grid trading is not exciting. It will not make you rich quickly. It will not generate Twitter-worthy P&L screenshots. What it will do — if configured correctly, in the right market conditions, with disciplined risk management — is extract a steady yield from the market’s most common state: boredom.
The 90-day test proved that a simple, well-parameterized grid bot on Pionex outperforms buy-and-hold in choppy markets while requiring zero daily intervention. The hardest part is the psychology of letting a machine trade your capital while you do nothing.
To get started:
- Sign up at Pionex using referral code HvkLD4aU for a permanent 10% fee discount
- Deposit USDT (start with $1,000–$2,000 to learn the mechanics)
- Navigate to Trade → Bot → Grid Trading
- Select BTC/USDT, set a range based on recent support/resistance, and use 30–40 grids
- Set a stop-loss 8–12% below your lower bound
- Launch the bot and walk away
Check it once a day. Do not tweak the parameters because you are bored. Do not panic-close it because BTC dropped 5%. The bot is doing exactly what you designed it to do: buying low, selling high, mechanically, forever, until the range breaks.
And when the range does break — because eventually, all ranges break — accept the stop-loss or the take-profit, book the result, and redeploy in the new range. Grid trading is not about being right about direction. It is about being right about boundaries.
Deploy your first grid bot on Pionex with code HvkLD4aU.
About the Author