
The Dollar Smile Theory dictates that the US Dollar (DXY) strengthens during extreme risk-off and extreme US economic outperformance, crushing Bitcoin in both phases. In 2026, you trade BTC by shorting DXY breakouts during the “middle of the smile” (Fed easing) and leveraging long BTC only when DXY mathematically peaks.
For years, retail crypto traders have operated under a dangerously simplistic macroeconomic assumption: “The Fed cuts rates, money printer goes brrr, Bitcoin goes up.” This linear thinking has liquidated countless portfolios. It ignores the complex, non-linear relationship between global liquidity, US economic exceptionalism, and the US Dollar Index (DXY).
In 2026, Bitcoin is no longer a niche internet money experiment; it is a highly correlated, high-beta macro asset. Its price action is inextricably linked to the plumbing of the US dollar. To navigate this environment, you must abandon retail narratives and adopt the institutional framework of the Dollar Smile Theory, originally conceptualized by Stephen Jen.
At Decentralised News, we operate on a fundamental principle: people do not buy financial tools to chase hype; they buy them to reduce risk. Understanding the Dollar Smile is the ultimate risk-reduction mechanism. It prevents you from buying Bitcoin at the exact moment the dollar is entering a structural bull market, and it gives you the mathematical conviction to leverage up when the dollar is structurally weakening. Below, we dissect the exact mechanics of the Dollar Smile, the mathematical formulas for calculating BTC beta, and the precise execution strategies required to trade Fed pivot cycles without falling victim to liquidation wicks.
1. The Anatomy of the 2026 Dollar Smile: Mapping the Three Phases of DXY Dominance
To trade the macro cycle, you must first understand the geometry of the Dollar Smile. Stephen Jen’s theory posits that the US Dollar tends to appreciate against major currencies in two distinct economic scenarios, forming a “smile” on a graph where the X-axis is US economic growth and the Y-axis is the value of the DXY.
For crypto traders, the DXY is the ultimate denominator. Because Bitcoin is priced in USD (BTC/USD), a strengthening DXY mathematically pressures the nominal price of Bitcoin, even if the underlying value of Bitcoin in terms of gold or other fiat currencies remains stable.
Phase 1: Global Risk-Off (The Left Side of the Smile)
The Macro Environment: Global economic contraction, geopolitical crises, or a severe credit event.
The DXY Action: The DXY surges aggressively. Capital flees emerging markets, equities, and crypto, seeking the ultimate safe haven: US Treasuries and cash.
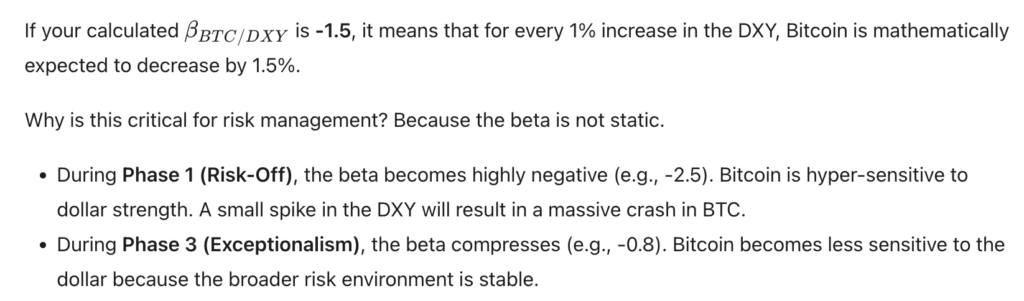
The BTC Correlation: Bitcoin acts purely as a high-beta risk asset. The correlation between DXY and BTC in this phase is heavily negative, typically hovering around -0.85 to -0.90.
The Retail Trap: Retail traders see a geopolitical crisis and buy Bitcoin, mistakenly believing the “digital gold” narrative. They are crushed as the DXY spikes and institutional algorithms sell BTC to raise cash. In Phase 1, cash is king, and Bitcoin is a liquidity exit.
Phase 2: US Economic Weakness and Fed Easing (The Bottom of the Smile)
The Macro Environment: The US economy slows down significantly, prompting the Federal Reserve to cut interest rates or halt Quantitative Tightening (QT). US growth underperforms the rest of the world.
The DXY Action: The DXY peaks and begins a structural decline. The interest rate differential between the US and other nations narrows, causing capital to flow out of the dollar and into higher-yielding or higher-growth assets globally.
The BTC Correlation: This is the “Goldilocks” zone for crypto. The correlation remains negative (-0.90), but the direction of the DXY is down. As the denominator (USD) weakens, the numerator (BTC) explodes. This is where 80% of Bitcoin’s cycle gains are realized.
The Institutional Edge: Smart money accumulates BTC aggressively at the bottom of the smile, front-running the retail crowd who only wake up when Bitcoin breaks its all-time high.
Phase 3: US Economic Exceptionalism (The Right Side of the Smile)
The Macro Environment: The US economy is growing significantly faster than Europe, Japan, and China. The Fed keeps interest rates “higher for longer” because the US economy can absorb them.
The DXY Action: The DXY grinds steadily higher. Capital flows into the US to capture the superior growth and high risk-free rates.
The BTC Correlation: The correlation is still negative, but weaker, around -0.60 to -0.75. Bitcoin does not crash violently as it does in Phase 1; instead, it experiences a slow, grinding bleed. Rallies are shallow and quickly sold into.
The Retail Trap: Retail traders try to “buy the dip” during Phase 3, not realizing that the macro headwind (a structurally strong dollar) will persist for months or years. They suffer death by a thousand cuts.
To accurately identify which phase of the smile we are currently in, you must overlay the DXY with the US Economic Surprise Index and the Federal Reserve’s dot plot. Analyze DXY correlations, map the three phases of the Dollar Smile, and build custom macro dashboards on TradingView to ensure your portfolio allocation matches the current macro regime.
2. The Mathematical Edge: Calculating BTC Beta Relative to DXY Intraday Moves
Understanding the phases of the Dollar Smile is qualitative; trading it profitably requires quantitative precision. You cannot simply guess how much Bitcoin will move when the DXY drops by 1%. You must calculate the exact BTC Beta to the DXY in real-time.
The Beta Formula
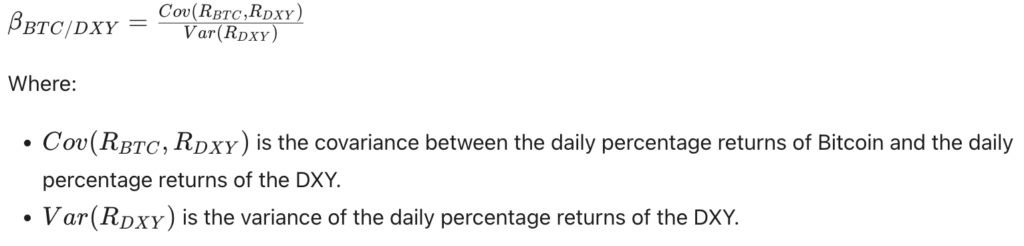
In traditional finance, beta measures the volatility of an asset relative to the broader market. In our macro framework, we calculate the rolling beta of Bitcoin relative to the US Dollar Index.
The formula for the rolling 30-day beta is:
Interpreting the Beta in 2026
Dynamic Position Sizing
Institutional traders use this beta to dynamically size their positions. If the DXY is approaching a major technical resistance level and your 30-day beta is -2.0, you must reduce your gross exposure to Bitcoin. If you are holding 10 BTC, and the beta spikes to -2.5, your effective risk has increased by 25%. You must sell 2.5 BTC or buy put options to maintain a constant risk profile.
Failing to adjust your position size based on rolling beta is why retail traders blow up during macro transitions. They use static position sizes in a dynamic, non-linear market. By calculating the exact beta, you remove emotion and rely purely on the mathematical reality of the market’s current sensitivity to the dollar.
3. The Fed Pivot Trap: Why “Cutting Rates” Doesn’t Always Mean “Bitcoin Pumps”
The most dangerous time to trade crypto is during a Federal Reserve pivot. The retail narrative dictates that the moment the Fed cuts the Federal Funds Rate, Bitcoin will instantly go parabolic. This is a catastrophic misunderstanding of why the Fed is cutting rates.
The Dollar Smile Theory perfectly illustrates the difference between the two types of rate cuts, and confusing them will result in immediate liquidation.
Insurance Cuts (Phase 3 transitioning to Phase 2)
An “insurance cut” occurs when the US economy is still relatively strong, but the Fed lowers rates slightly to prevent a slowdown or to normalize policy after a tightening cycle.
- The DXY Reaction: The DXY often rallies or stays flat during the first few insurance cuts. Why? Because the rate cuts are priced in, and the US economy is still outperforming the rest of the world (Right side of the smile).
- The BTC Reaction: Bitcoin typically chops sideways or bleeds slowly. The “sell the news” event is brutal. Retail traders who leveraged long at the exact moment of the first rate cut are stopped out by the ensuing volatility.
Panic Cuts (Phase 1 transitioning to Phase 2)
A “panic cut” occurs when the US economy is entering a severe recession, unemployment is spiking, and the credit market is freezing. The Fed is forced to slash rates aggressively to save the system.
- The DXY Reaction: Initially, the DXY will spike violently as the recession triggers a global risk-off flight to safety (Left side of the smile). Bitcoin will crash hard during this initial phase. However, once the Fed begins massive liquidity injections (QE), the DXY will violently reverse and collapse (Bottom of the smile).
- The BTC Reaction: Bitcoin will initially crash alongside equities. But once the DXY peaks and the panic cuts transition into full QE, Bitcoin will experience the most violent, parabolic upside of the entire cycle.
The 2026 Pivot Playbook
To trade the 2026 Fed pivot, you must monitor the US 2-Year/10-Year Treasury Yield Curve and the Initial Jobless Claims.
- If the yield curve is steepening and jobless claims are low, the Fed is doing insurance cuts. Stay in cash or stablecoins; do not leverage long BTC.
- If the yield curve is deeply inverted and jobless claims are spiking above 250k, a panic cut is imminent. Prepare to buy the violent DXY spike (the Phase 1 crash in BTC) with limit orders, positioning for the massive Phase 2 breakout.
4. Execution Mechanics: Structuring Macro Hedges Without Liquidation Wicks
Identifying the macro regime and calculating beta is only half the battle. The crypto market in 2026 is plagued by algorithmic stop-hunting and “scam wicks” designed to liquidate over-leveraged retail traders. If your execution mechanics are poor, you will be liquidated on a 10% wick even if your macro thesis on the Dollar Smile was 100% correct.
The Danger of Static Stop-Losses in a High-Beta Environment
When the DXY breaks out of a multi-month consolidation, volatility expands. If you have a static stop-loss on your Bitcoin long position, market makers will push the price down to trigger your stop, grab your liquidity, and then reverse the price in the direction of your original thesis.
Implementing Volatility-Adjusted Stops
Instead of static percentage stops, you must use volatility-adjusted stops, such as the Average True Range (ATR) or the Keltner Channels.
- Calculate the 14-day ATR on the 4-hour Bitcoin chart.
Set your stop-loss at 2x the ATR below your entry price.
- This ensures that your stop is wide enough to absorb the normal “noise” and algorithmic wicks of the market, but tight enough to invalidate your thesis if the macro structure truly breaks.
Hedging with Options and Perpetual Funding
If you are accumulating Bitcoin spot during a Phase 2 DXY breakdown, you must hedge against a sudden Phase 1 risk-off event (e.g., a geopolitical black swan).
- Options Hedging: Use a portion of your portfolio to buy Out-of-the-Money (OTM) Bitcoin Put options. If the DXY spikes and BTC crashes, the puts will increase in value, offsetting the loss on your spot position.
- Funding Rate Arbitrage: Monitor the perpetual futures funding rates. If the market is overly bullish and funding rates are highly positive, the cost of holding a long position becomes expensive. In this scenario, reduce your spot exposure and move into a delta-neutral funding rate arbitrage strategy until the DXY confirms its breakdown.
When executing complex macro hedges, managing leverage, and trading during high-volatility Fed announcements, you need an exchange with deep liquidity and robust risk management tools. Execute macro hedges, adjust leverage dynamically, and trade DXY-correlated proxies on Bybit using code 46164. Bybit’s institutional-grade matching engine and advanced risk management interface ensure that your hedges are executed precisely, protecting your capital from the violent wicks that characterize macro transition periods.
5. The 2026 Cheat Sheet: 4 Exact Setups to Trade the Dollar Smile
To operationalize the Dollar Smile Theory, you need a strict, rules-based playbook. Below are the four exact setups that institutional macro traders use to extract alpha from DXY correlations in 2026.
Setup 1: The Left-Side Reversal (The Phase 1 Bottom)
- Macro Condition: Global VIX > 30. US 10-Year Yield spiking.
- DXY Technical: DXY hits the upper 2-standard-deviation Bollinger Band on the weekly chart. RSI > 75.
- Action: Begin scaling into Bitcoin spot with limit orders. The DXY is overextended, and a mean-reversion is mathematically imminent.
- Risk Management: Keep leverage at 1x. This is a falling knife environment; you are catching the bottom of the risk-off phase.
Setup 2: The Bottom Breakout (The Phase 2 Goldilocks)
- Macro Condition: Fed officially begins rate cuts. US PMI drops below 50 (contraction).
- DXY Technical: DXY breaks and closes below the 200-day Simple Moving Average (SMA).
- Action: Aggressively leverage long Bitcoin. The DXY has entered a structural bear market. The cost of capital is falling, and risk assets will reprice higher.
- Risk Management: Use 3x to 5x leverage. Set trailing stops based on the 14-day ATR.
Setup 3: The Right-Side Grind (The Phase 3 Bleed)
- Macro Condition: US Non-Farm Payrolls consistently beat expectations. ECB and BOJ are cutting rates while the Fed holds.
- DXY Technical: DXY is trading above the 50-day SMA and making higher highs.
- Action: Short Bitcoin rallies. The macro headwind is too strong. Any Bitcoin pump is a liquidity trap.
- Risk Management: Keep position sizes small. Phase 3 grinds are slow and painful. Use low leverage (1x to 2x) and target the lower bounds of the Bitcoin trading range.
Setup 4: The Pivot Fakeout (The Insurance Cut Trap)
- Macro Condition: Fed cuts rates by 25bps, but inflation metrics (Core PCE) remain sticky.
- DXY Technical: DXY initially dips on the news, then violently reverses and closes green on the daily candle.
- Action: Short Bitcoin immediately. The market has mispriced the cut as a “panic cut” when it is actually an “insurance cut.” The DXY will continue to strengthen, and Bitcoin will retrace the entire fakeout rally.
- Risk Management: Tight stop-loss just above the wick of the news event candle.
Conclusion: Mastering the Denominator
The era of trading Bitcoin in a vacuum is over. In 2026, Bitcoin is a mature, globally integrated macro asset, and its price is fundamentally a reflection of the value of the US Dollar.
The Dollar Smile Theory is not just an academic concept; it is the definitive framework for understanding global liquidity flows. By mapping the three phases of the DXY—global risk-off, US economic weakness, and US exceptionalism—you can accurately predict the macro headwinds and tailwinds facing Bitcoin.
More importantly, by calculating the rolling beta and executing volatility-adjusted hedges, you protect your capital from the violent liquidation wicks that destroy retail traders during Fed pivots. You stop reacting to the news and start anticipating the mathematical reality of the market.
Decentralised News is committed to providing you with the institutional-grade intelligence required to navigate this complex landscape. We do not deal in hype; we deal in the structural realities of global finance. Master the Dollar Smile, respect the denominator, and you will secure your financial sovereignty in the 2026 macro cycle.
Frequently Asked Questions (FAQ)
1. What is the Dollar Smile Theory and how does it apply to crypto?
The Dollar Smile Theory, developed by Stephen Jen, states that the US Dollar (DXY) strengthens during extreme global risk-off (flight to safety) and during extreme US economic outperformance. In crypto, because Bitcoin is priced in USD, a strengthening DXY acts as a massive headwind. Crypto traders use the theory to identify when the DXY is peaking (the bottom of the smile) to aggressively accumulate Bitcoin, and when the DXY is structurally strengthening (the sides of the smile) to reduce risk.
2. How does the DXY correlation affect Bitcoin price action?
The correlation between the DXY and Bitcoin is generally negative. When the DXY rises, Bitcoin typically falls, and vice versa. However, the strength of this correlation changes based on the macro regime. During a global panic (Phase 1), the negative correlation is extremely high (-0.90), meaning Bitcoin crashes hard when the dollar spikes. During US economic exceptionalism (Phase 3), the correlation weakens (-0.60), resulting in a slow grind lower for Bitcoin.
3. What is the difference between an “insurance cut” and a “panic cut” for crypto?
An “insurance cut” happens when the Fed lowers rates slightly to sustain a strong economy; this often causes the DXY to stay strong and Bitcoin to chop or bleed (Phase 3). A “panic cut” happens during a recession; the DXY initially spikes as Bitcoin crashes (Phase 1), but once the Fed injects massive liquidity, the DXY collapses and Bitcoin enters a parabolic bull run (Phase 2). Buying the first rate cut without knowing which type it is will often result in heavy losses.
4. How do I calculate BTC beta to the US Dollar Index?
You calculate the rolling beta using the formula: Covariance of BTC and DXY daily returns divided by the Variance of DXY daily returns. A beta of -1.5 means that for every 1% the DXY goes up, Bitcoin goes down by 1.5%. Traders use this metric to dynamically adjust their position sizing and leverage based on how sensitive Bitcoin currently is to dollar movements.
5. Can I short the DXY directly on crypto exchanges to hedge my Bitcoin portfolio?
While some specialized platforms offer DXY perpetual futures, the most effective way to hedge DXY risk on standard crypto exchanges is by dynamically adjusting your Bitcoin leverage, utilizing the funding rate arbitrage, or buying Out-of-the-Money (OTM) Bitcoin put options. By reducing your gross exposure or buying puts when the DXY is structurally strengthening, you effectively hedge your portfolio against dollar-driven drawdowns.
About the Author