The 2026 Yield Shock: AI Capex, Fiscal Deficits and Bitcoin’s Macro Test
This article discusses macroeconomic conditions and cryptocurrency markets for informational purposes only. It is not financial advice. Digital assets are volatile and can lose value rapidly; consult a licensed advisor before making investment decisions.
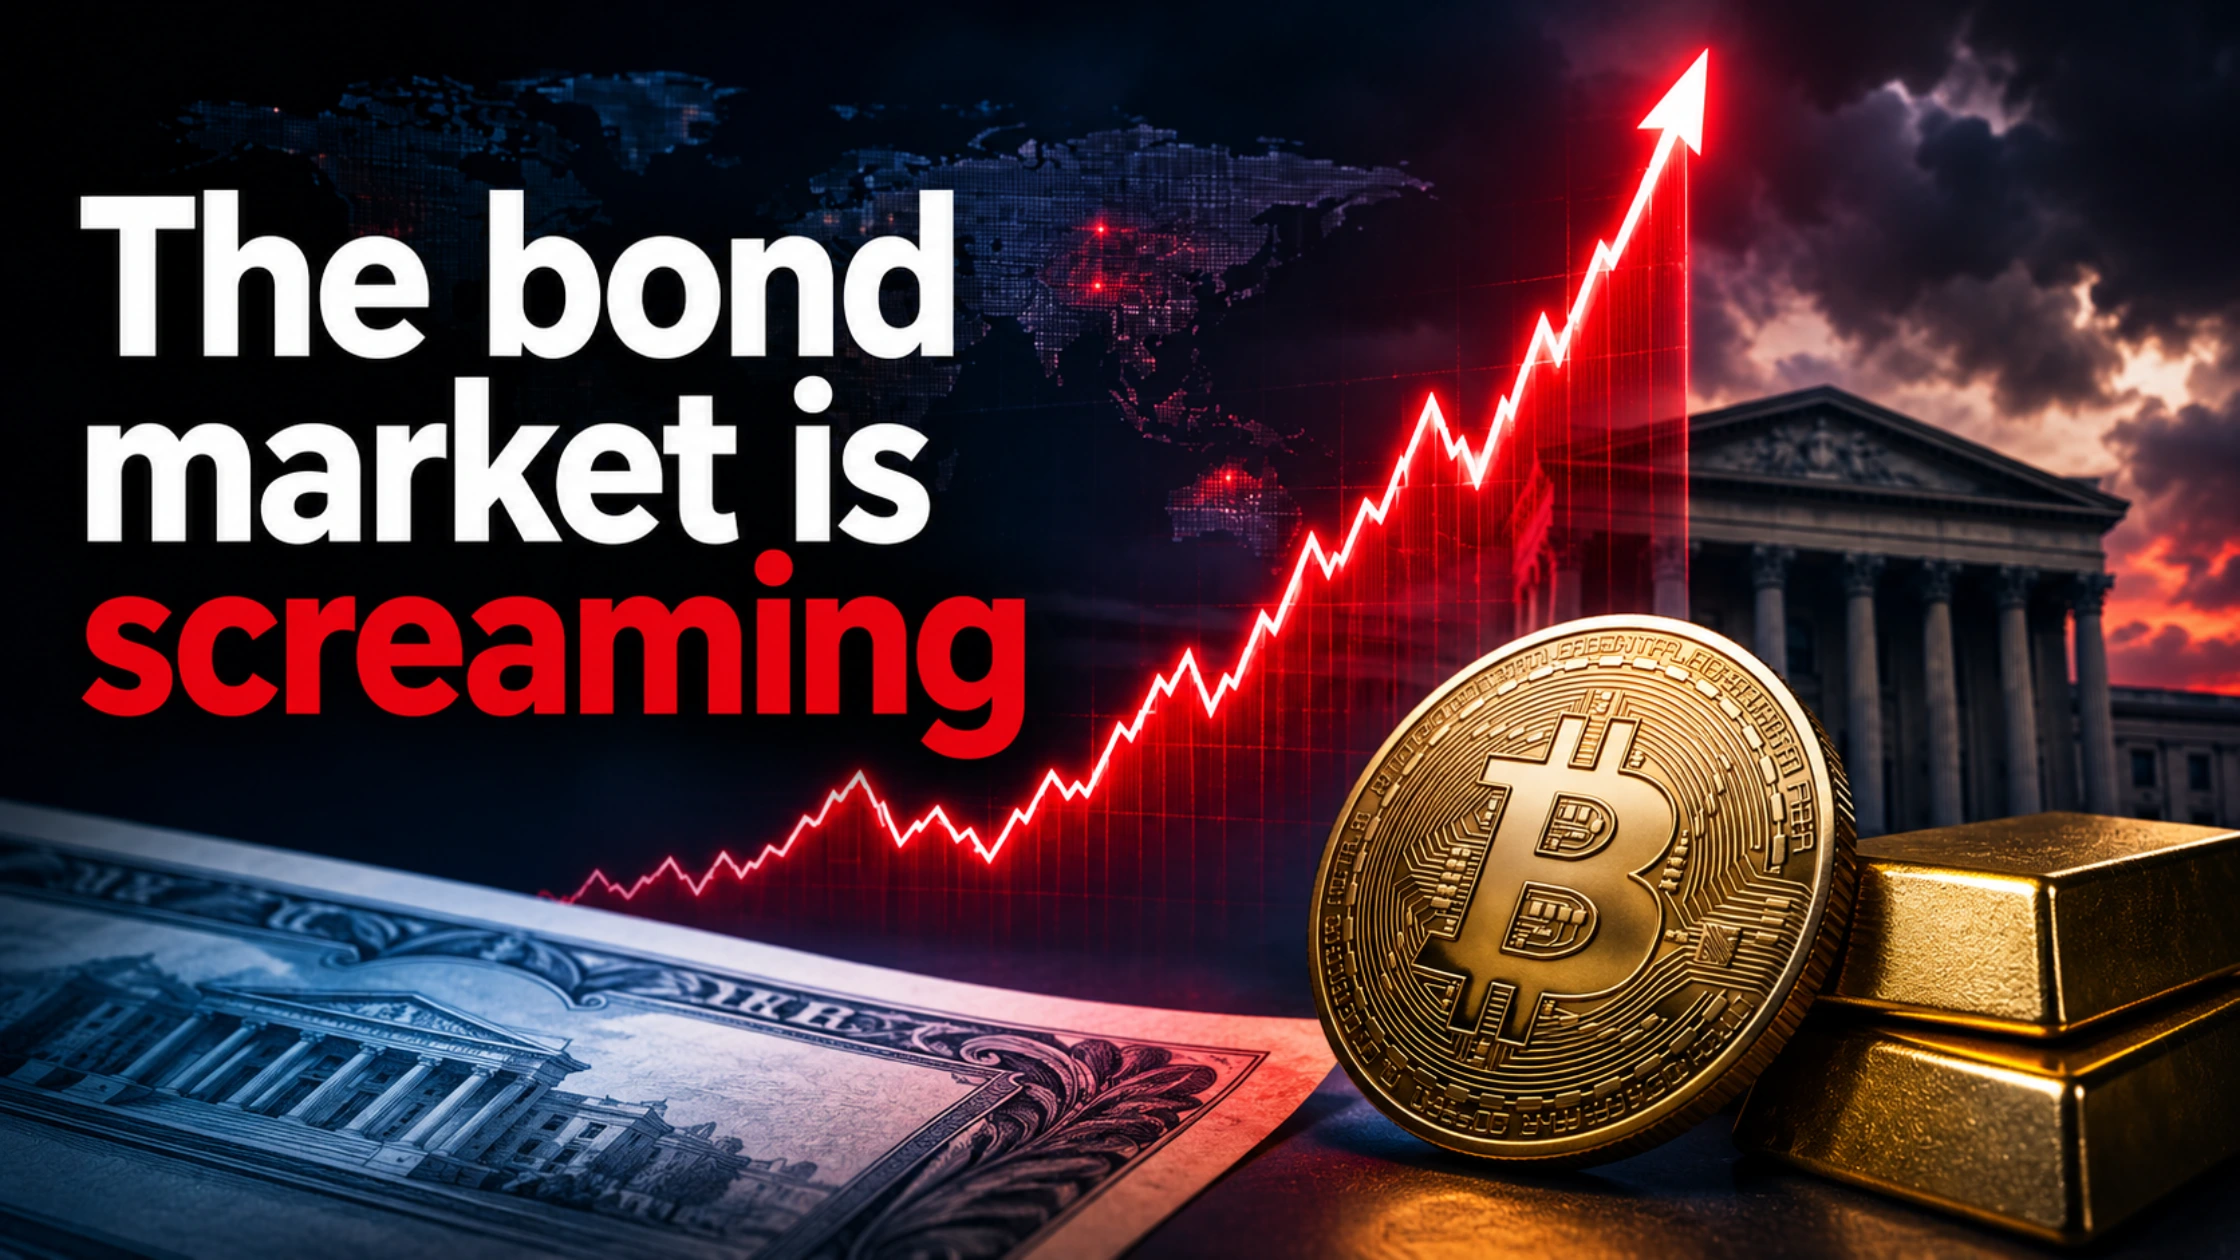
The Bond Market Is Screaming: Inside the 2026 Global Yield Shock, the Real Debasement Trade, and Where Crypto Goes From Here
Summary: Long-term government bond yields across the US, Japan, Germany, France and the UK hit multi-decade highs in August 2026, led by the US 30-year Treasury topping 5% for the first time since 2007. The proximate driver is not fear of sovereign default but a collision of AI-infrastructure borrowing and swollen fiscal deficits competing for the same pool of savings, a distinction confirmed by flat inflation breakevens and quiet credit-default-swap markets. Separately, gold has decoupled from that inflation story, rallying on central-bank buying and reserve diversification rather than breakeven inflation. Crypto, still down roughly 46% from its October 2025 market-cap peak, sits at the intersection of both stories: a high-beta risk asset punished by rising real yields, and a candidate debasement hedge whose thesis depends on regulatory clarity that Congress has repeatedly failed to deliver. Below, we build the case, quantify the mechanics with DN’s Debasement Divergence Ledger, and lay out concrete scenarios.
The number that should worry every portfolio, not just bond desks
On August 18, 2026, the yield on the 30-year US Treasury bond climbed to 5.324%, its highest level since June 2007. The 10-year followed it to 4.736%. Across the Atlantic and the Pacific the picture was the same: Japan’s 10-year government bond yield rose to 2.945%, a three-decade high, Germany’s 10-year Bund pushed past its highest level since 2011, and France’s 10-year OAT touched its worst level since 2009, with the French 30-year at its highest since 2008. Britain’s 30-year gilt traded near 5.85%, a level last seen in May.
None of these governments are broke. What is happening is more interesting, and more relevant to how you should think about the next twelve months of monetary policy and capital flows.
Two different reasons rates rise, and why the distinction matters
There are only two structural reasons government borrowing costs climb. The first is that demand for credit in the economy is running ahead of the available supply of savings. The second is that investors have started pricing in a real risk of default or deliberate currency debasement and are demanding a bigger premium to hold the debt.
These sound similar from a headline chart. They are not similar at all in terms of what happens next.
As Nobel laureate economist Paul Krugman argued in an August 19 note, the current US move looks overwhelmingly like the first case. Two forces are pulling directly on the pool of investable capital. The first is the AI infrastructure buildout: hyperscalers that used to fund data-center capex out of monopoly cash flow are now issuing bonds because spending has outrun even their extraordinary profits. The second is the federal deficit itself, which by relative size has only been larger twice in 35 years, during the aftermath of the 2008 crisis and the depths of the pandemic. Both borrowers are showing up in the same market at the same time, bidding up the price of long-duration capital.
If this were instead a debt-crisis story, that is, markets losing faith that the US will honor its obligations without inflating them away, it should show up unmistakably in two places: breakeven inflation and credit default swaps. Neither has moved. The 10-year breakeven inflation rate sat at 2.25% in August 2026, essentially anchored to where it has traded for most of the past two years, and US sovereign CDS pricing has stayed muted. Markets are not pricing a Greek-style crisis. They are pricing a genuine supply-and-demand crunch for long-term capital, worsened by a war-driven spike in oil prices above $91 a barrel that keeps inflation stickier than the Fed would like.
That distinction matters enormously for anyone trying to position around what comes next, because a credit-crowding regime and a currency-crisis regime resolve in opposite directions. A crowding-out story eases once AI capex growth decelerates or deficits shrink, neither of which is imminent. A genuine debasement panic tends to feed on itself until policy changes credibly.
The debasement trade is real, it’s just hiding somewhere else
Here is the part most coverage of the bond selloff is missing: while breakeven inflation stayed anchored, gold did something breakevens did not predict at all. Gold traded near $4,393 an ounce in mid-August 2026, having pulled back roughly 17% from a cycle high above $5,300 earlier in the year, but still enormous relative to where it traded even three years ago. The historical relationship between gold and breakeven inflation, tight for three decades, broke down between 2022 and 2026. Gold kept climbing even as the market’s inflation forecast stayed flat.
That gap is the debasement trade, and it is not primarily an inflation bet. It looks much more like a structural, slow-moving reallocation: central banks diversifying reserves away from a concentration in US Treasuries, sovereign wealth funds hedging against a world of larger deficits and higher real financing costs, and private capital seeking assets whose supply nobody in Washington, Frankfurt or Tokyo can vote to expand. J.P. Morgan’s commodities desk has pointed gold toward $6,000 an ounce by the end of 2026 on exactly this logic, while flagging that a genuinely hawkish Fed determined to fight energy-driven inflation is the main risk to that call.
Bitcoin is routinely marketed as the same trade with a digital wrapper. The 2026 price action argues that, so far, it has traded far more like a high-beta tech stock than a debasement hedge.
Why crypto fell while the debasement story strengthened
Total crypto market capitalization peaked near $4.27 trillion on October 6, 2025, and has since fallen to roughly $2.3 trillion, a drawdown of about 46%. Bitcoin fell from its $126,080 all-time high to around $64,000, a decline of roughly 49%, worse than the S&P 500’s 2025 to 2026 experience and closer in magnitude to the drawdown gold itself avoided.
The mechanism traces directly back to the “financial gravity” concept that governs every discounted asset. A rising real yield, the nominal long bond yield minus expected inflation, raises the rate used to discount an asset’s future cash flows back to today’s dollars. Assets whose value depends heavily on profits many years in the future, which describes the median crypto-adjacent equity and a large share of speculative token valuations, get pulled down hardest. The US real 10-year yield sat near 1.9% to 2.5% through the back half of the selloff, a level restrictive enough on its own, according to market commentary, to matter more than the inflation outlook itself right now.
Layer on top of that four additional pressures specific to 2026: US spot Bitcoin ETFs posted their first cumulative negative-flow year since launch, draining roughly $7.2 billion across back-to-back record outflow streaks in May and June; a widely discussed sale of Bitcoin by a major corporate treasury rattled sentiment in June; the prolonged Iran conflict pushed energy prices higher, feeding directly into the same inflation-adjacent fears pressuring bonds; and the Federal Reserve, now under new leadership, has been criticized for unclear communication at precisely the moment markets needed certainty.
The result is a crypto market trading on the same discount-rate mechanics as unprofitable growth tech, not on the debasement logic that is actually playing out in the gold market. That is either crypto’s biggest current weakness or its biggest unpriced opportunity, depending on which catalyst arrives first.
DN Debasement Divergence Ledger
Classify today's bond-yield regime, quantify the real yield, and model the financial-gravity effect on risk-asset valuations.
Nobody publishes a live, plain-English number for how much of the current rate story is credit crowding versus genuine currency debasement fear, or what that split implies for a hard-asset rotation. The DN Debasement Divergence Ledger fixes that. Enter the nominal long yield, the breakeven inflation rate and your own view on how sensitive Bitcoin is to further real-yield moves, and the tool classifies the regime, quantifies today’s real yield, models the financial-gravity discount effect on a distant cash flow, and produces an illustrative rotation range grounded in the mechanics above rather than a hardcoded prediction.
What actually turns this around
Five variables will decide whether the second half of 2026 looks like more of the same or a genuine turn.
Fed policy under new leadership. The federal funds rate has sat in a 3.5% to 3.75% range through mid-2026, with persistent inflation making a meaningful cut politically and economically difficult. Markets are watching the September Federal Open Market Committee meeting’s dot plot as closely as the decision itself; a signal of fewer future cuts than priced would extend the same repricing that hit markets after the December 2024 cut, when a headline-friendly rate reduction still sent yields higher because the accompanying guidance was more hawkish than expected.
Oil and the Iran conflict. Brent crude above $90 a barrel is doing double duty, keeping headline inflation stubborn and reinforcing the market’s belief that central banks cannot cut rates freely. A durable ceasefire would remove a genuine supply-shock component from the inflation debate, something monetary policy cannot fix on its own no matter how high rates go.
AI capex trajectory. The credit-crowding thesis depends on hyperscaler bond issuance continuing to compete with government debt for the same capital. Any deceleration in data-center spending, whether from an AI-investment air pocket or simply diminishing returns on the next marginal dollar of compute, would relieve pressure on long-term yields directly.
Fiscal policy. Krugman’s own framing is worth taking at face value regardless of one’s politics: with the deficit now competing directly with AI capex for savings, any credible move to narrow it, from either party, would ease the demand side of the crowding-out equation. Nothing in the current US political calendar suggests that is imminent.
Regulatory clarity for digital assets. This is the variable most specific to crypto’s own prospects. The Digital Asset Market Clarity Act passed the House by a lopsided 294-134 vote back in July 2025 and cleared the Senate Banking Committee 15-9 in May 2026, but stalled repeatedly over the summer on disputes involving presidential crypto holdings, DeFi developer protections under the Blockchain Regulatory Certainty Act, and stablecoin yield rules. The Senate filed a cloture motion on August 8, 2026, with the next procedural vote scheduled for September 15. Prediction markets have swung from pricing an 82% chance of 2026 passage in February to closer to a coin flip by late summer. Passage would hand institutional allocators the statutory certainty that JPMorgan and Standard Chartered analysts have both cited as a prerequisite for larger-scale participation, potentially decoupling crypto’s price action from pure real-yield beta for the first time. Failure pushes the question into 2027, with some analysts warning a missed 2026 window could delay comprehensive legislation for years given the November midterms.
How to read the next print
The single most useful mental model from all of this: markets do not move on whether news is good or bad in isolation, they move on whether it beats or misses what was already priced in. A Fed rate cut that arrives alongside a hawkish dot plot is bad news dressed as good news, exactly what happened on December 18, 2024, when a quarter-point cut coincided with falling stocks, rising Treasury yields and a stronger dollar because the projected future path of rates moved higher even as today’s rate moved lower.
Applied to the rest of 2026: watch the gap between what the Fed’s dot plot signals about the path of rates and what Fed funds futures currently price in. Watch whether breakeven inflation stays anchored near 2.25% or starts drifting toward the market’s fears about tariffs and oil. And watch whether gold’s premium to what breakevens alone would predict keeps widening, because that gap is the cleanest real-time read on how much genuine debasement anxiety, as opposed to ordinary credit-market crowding, is actually priced into global markets.
Where to position around this cycle
Investors looking to trade the resulting volatility across both traditional and digital markets can do so through Bybit or OKX, both of which offer derivatives exposure to majors like Bitcoin and Ethereum for those looking to hedge or express a view on the real-yield-driven repricing described above. For those following the structural debasement thesis toward long-term self-custody rather than short-term trading, a hardware wallet such as Ledger remains the standard way to hold the underlying asset outside exchange counterparty risk.
Frequently asked questions
Why did the US 30-year Treasury yield hit its highest level since 2007? A combination of massive AI-infrastructure bond issuance by hyperscalers, a near-record federal budget deficit, and oil prices above $90 a barrel tied to the prolonged Iran conflict have all pushed demand for long-term capital ahead of available supply, forcing the government to offer a higher yield to attract buyers.
Is the US at risk of a Greek-style debt crisis? Available evidence says no. If markets feared default or deliberate inflation of the debt away, that fear would show up in rising breakeven inflation rates and wider credit default swap spreads on US debt. Neither indicator has moved materially in 2026, suggesting the yield rise reflects ordinary credit demand rather than solvency fear.
What is the difference between the inflation trade and the debasement trade? The inflation trade bets on rising consumer prices and typically tracks breakeven inflation rates. The debasement trade is a longer-horizon bet on currency and reserve-asset diversification, visible in 2026 through gold’s rally decoupling from a flat breakeven inflation rate rather than tracking it.
Why has Bitcoin fallen roughly 49% from its all-time high while gold has held up better? Bitcoin has traded predominantly as a high-beta, long-duration risk asset sensitive to rising real yields, similar to unprofitable growth tech stocks, while gold has benefited from central bank and sovereign reserve diversification demand that is less correlated with real rates.
What is the CLARITY Act and why does it matter for crypto prices? The Digital Asset Market Clarity Act is federal legislation that would divide regulatory oversight of digital assets between the SEC and CFTC, creating a statutory framework in place of the current enforcement-driven approach. It passed the House in July 2025 and remains stalled in the Senate as of August 2026, with a procedural vote scheduled for September 15. Analysts view its passage as a potential catalyst for institutional capital that has stayed on the sidelines pending regulatory certainty.
What is a breakeven inflation rate? It is the difference between the yield on a standard Treasury bond and an inflation-protected Treasury (TIPS) of the same maturity, representing the market’s implied forecast for average annual inflation over that period.
How does the Federal Reserve’s policy rate affect a 30-year mortgage or Treasury yield? Indirectly. The Fed directly sets only the overnight federal funds rate. Long-term yields reflect market expectations for the average path of that rate over decades, plus a term premium for the uncertainty of lending over a long horizon, which is why long-term rates can rise even after the Fed cuts short-term rates.
Could rising bond yields trigger a broader stock market selloff? Higher long-term yields raise the discount rate used to value future corporate profits, which mechanically lowers the present value of growth stocks in particular. Whether this triggers a broader selloff depends on whether earnings growth can offset that higher discount rate, which the transcript-based “financial gravity” framework above addresses directly.
Is now a good time to buy gold or Bitcoin as an inflation hedge? This is not investment advice. Both assets carry distinct risk profiles, current breakeven inflation is anchored near 2.25% rather than spiking, and Bitcoin in particular has shown high sensitivity to real-yield moves in 2026. Anyone considering either asset as a hedge should assess their own risk tolerance and consult a licensed financial advisor.
Decentralised News maintains E-E-A-T standards through primary-source verification of all yield, inflation and market-cap data cited above, sourced from Federal Reserve H.15 releases, Reuters, Bloomberg and CoinGecko reporting current as of August 19, 2026. Figures are point-in-time snapshots and will move; treat all yield and price levels as illustrative of the trend described rather than live quotes.
About the Author