Bitcoin Bottomed, Bull Market Begins? How to Analyse Market Cycles
How to Spot a Market Bottom
There are several indicators that signal a bottom in market dynamics and cycles for stocks and crypto. These include:
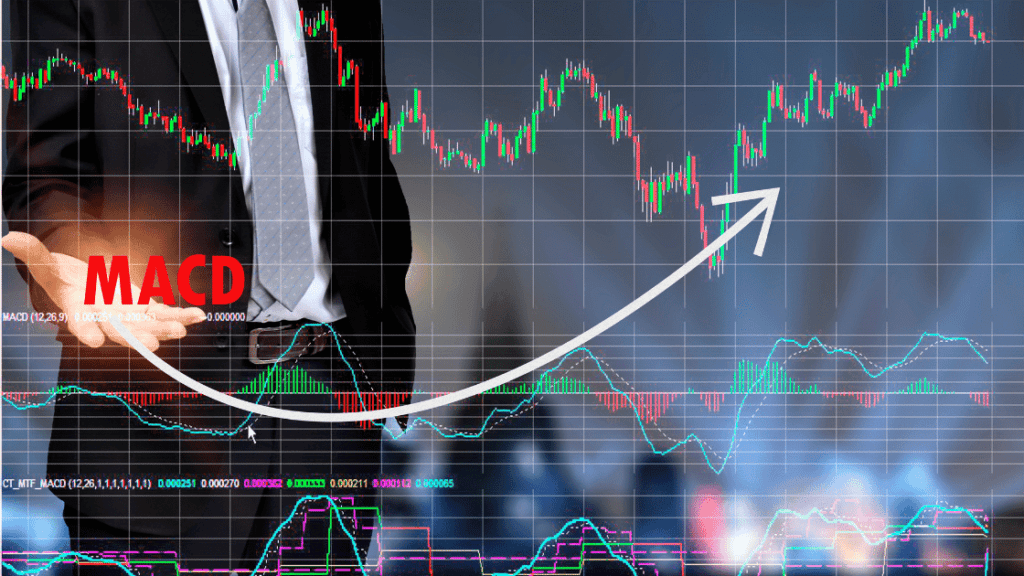
- Moving Average Convergence Divergence (MACD) – This indicator compares the difference between two moving averages of a security’s price, and is used to identify bullish or bearish momentum. A bullish crossover, where the shorter-term moving average crosses above the longer-term moving average, can signal a bottom in the market.
- Relative Strength Index (RSI) – The RSI is used to measure the strength of a security’s price action, and is often used to identify overbought or oversold conditions. A reading below 30 on the RSI can signal that a security is oversold, and may be approaching a bottom in the market.

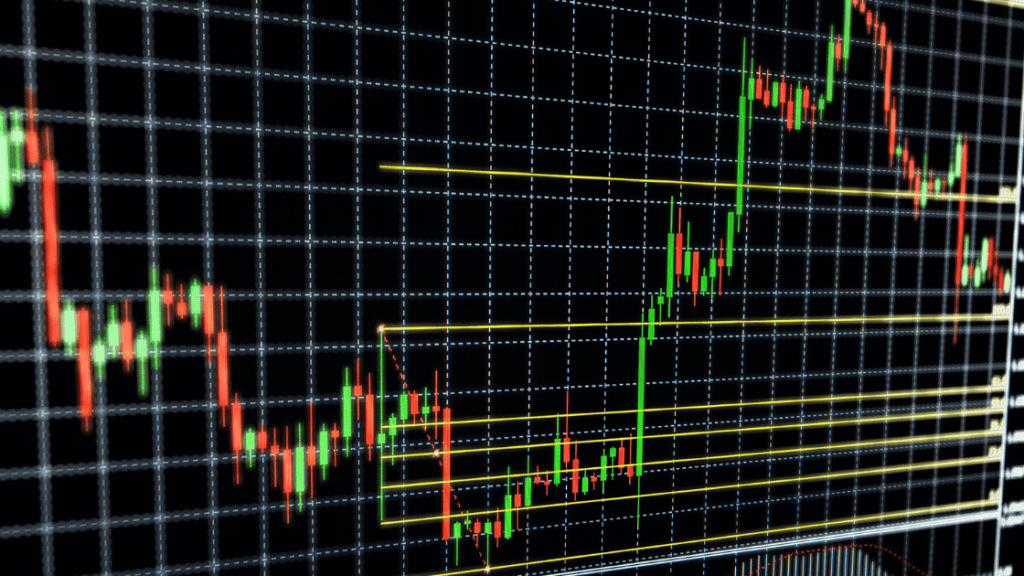
- Fibonacci retracement – This indicator uses horizontal lines to indicate areas where a security’s price may experience support or resistance. The Fibonacci retracement levels, such as 23.6%, 38.2%, and 61.8%, are commonly used to identify potential bottoms in the market.
- Volume – Increased trading volume can be an indicator of a bottom in the market. When prices are low, investors may see a buying opportunity, and increased buying activity can lead to increased trading volume.
Historically, market bottoms have occurred during periods of economic recession or financial crisis. For example, the bottom of the 2008 financial crisis was marked by the failure of several large financial institutions and a significant decrease in stock prices. Similarly, the bottom of the dot-com bubble in 2001 was marked by a decrease in technology stock prices and a decrease in the overall market.
It’s worth noting that these indicators are not always accurate and that there is no guaranteed way to predict market bottoms.
Bull Market Indicators Explained
There are several indicators that signal the start of a bull market cycle in stocks or crypto. These include:
- Moving Average Convergence Divergence (MACD) – A bullish crossover, where the shorter-term moving average crosses above the longer-term moving average, can signal the start of a bull market cycle.
- Relative Strength Index (RSI) – A reading above 70 on the RSI can signal that a security is overbought, and may be approaching the start of a bull market cycle.
- Breakout – A breakout occurs when a security’s price moves above a key resistance level, such as a previous high or a trendline. This can signal the start of a bull market cycle, as it indicates that the security’s price is likely to continue to rise.

- Volume – Increased trading volume can be an indicator of the start of a bull market cycle. When prices are rising, investors may see a buying opportunity, and increased buying activity can lead to increased trading volume.

In order to forecast the direction of the market and the shift from downtrend to uptrend or bull market cycle, analysts use a combination of these indicators along with other tools such as trend analysis, chart patterns, and on-chain data on volumes and users. The cyclical dynamics of market cycles can be analyzed using various tools such as Fibonacci retracements and Elliott wave analysis.

Historically, bull market cycles have occurred during periods of economic expansion and growth. For example, the bull market of the 1990s was characterized by strong economic growth, low unemployment, and rising stock prices. Similarly, the bull market of the 2010s was characterized by a recovering economy and rising stock prices.
It’s worth noting that these indicators are not always accurate and that there is no guaranteed way to predict market trends. The risks of using market trend forecasting indicators include the risk of missing out on potential gains if the market does not follow the forecasted trend. On the other hand, the benefit of being able to make informed decisions about when to enter or exit the market is why most experienced traders and investors still consider a wide range of indicators when making investment or trading decisions.
Fundamental and Technical Analysis
Fundamental analysis helps traders and investors evaluate the intrinsic value of an asset, while technical analysis helps them identify patterns and trends that can be used to predict future price movements. Both methods can be used together to make better trading or investing decisions, but it is important to remember that past performance is not always indicative of future results.
Fundamental analysis is a method of evaluating the intrinsic value of an asset by examining its underlying financial and economic factors. This includes analyzing financial statements, such as balance sheets and income statements, as well as economic indicators, such as GDP and inflation. The goal of fundamental analysis is to determine the underlying value of an asset, and to identify whether it is undervalued or overvalued.
Technical analysis, on the other hand, is a method of evaluating an asset by analyzing its past price and trading volume data. This includes studying charts and other technical indicators, such as moving averages and relative strength index (RSI), in order to identify patterns and trends that can be used to make predictions about future price movements.
An example of using fundamental analysis for a stock trader or investor:
- A trader would examine the financial statements and key performance indicators (KPIs) of a company to determine the underlying value of the stock and compare it to the current market price. If the intrinsic value is significantly higher than the current market price, the trader may identify the stock as undervalued and consider buying it as a long-term investment.
An example of using technical analysis for a crypto trader or investor:
- A trader would analyze historical price and trading volume data of a cryptocurrency, looking for patterns and trends such as a bullish trend or a head and shoulders pattern. Based on these analyses, traders may decide to buy or sell the cryptocurrency on different marketplaces such as Bybit, Binance, OKX, Paxful, gTrade, ApeX, Coinbase and others.
It’s important to note that no single analysis is foolproof and it’s always better to use a combination of both fundamental and technical analysis to make informed decisions.
Head and Shoulder Pattern Explained

A head and shoulders chart pattern is a technical analysis pattern that is used to identify potential trend reversals. It is a bearish reversal pattern that is formed when the price of an asset creates a peak (the “head”), followed by a higher peak (the “left shoulder”), and then a lower peak (the “right shoulder”), before falling again. The pattern is considered complete when the price falls below a “neckline” that connects the lows of the left and right shoulders.
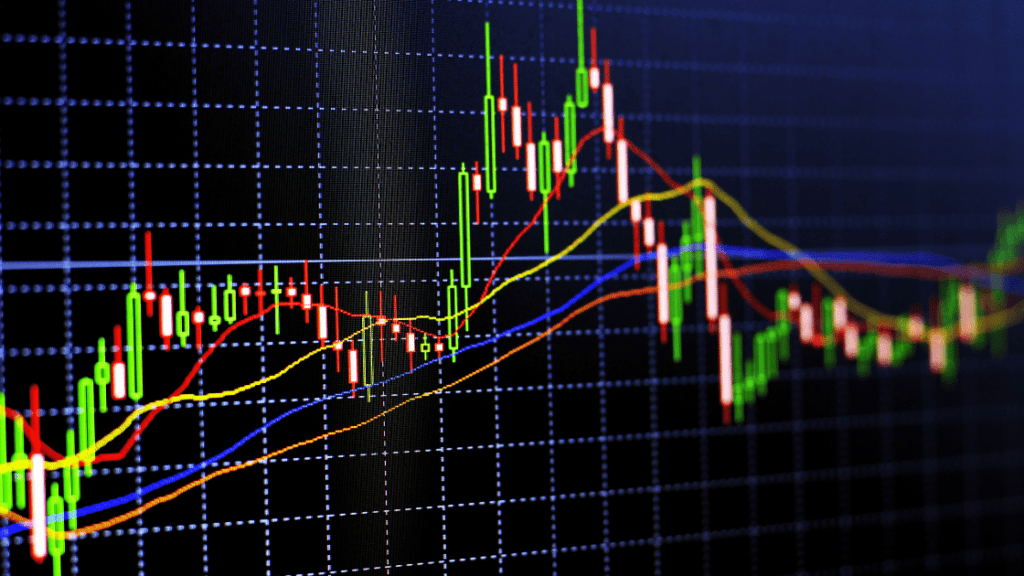
The head and shoulders pattern is thought to indicate that the asset’s price has reached a peak and that a reversal of the current uptrend is likely. The pattern is named after its appearance, which is said to resemble a head with two shoulders.
Moving Averages Explained
A moving average is a technical indicator that is used to smooth out fluctuations in an asset’s price over time. It is calculated by taking the average of a set of data points (such as closing prices) over a specified number of periods (such as days or weeks). The resulting line is then plotted on a chart to help traders identify trends and potential buying or selling opportunities.
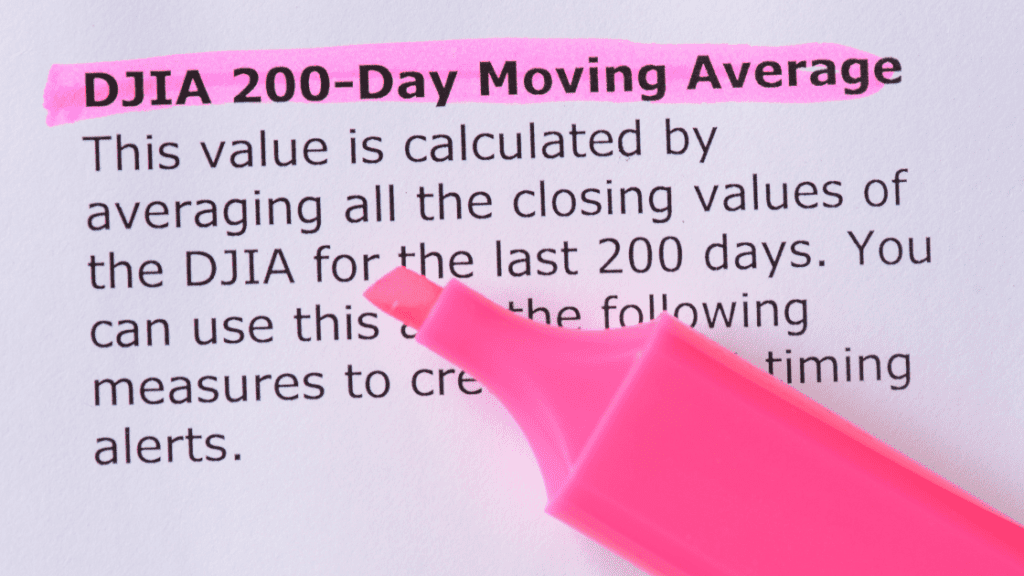
There are several different types of moving averages, including the simple moving average (SMA), the exponential moving average (EMA), and the weighted moving average (WMA). Each type uses a slightly different method to calculate the average, but they all serve the same basic purpose of smoothing out fluctuations in price.
Simple Moving Average: A simple moving average is calculated by adding together a set of data points (such as closing prices) and then dividing the sum by the number of data points. For example, a 20-day simple moving average would be calculated by adding together the closing prices for the past 20 days and then dividing the sum by 20. The resulting average is then plotted on a chart.
Exponential Moving Average: An exponential moving average gives more weight to more recent data. The EMA is calculated by applying a percentage of today’s closing price to yesterday’s EMA.
Weighted Moving Average: A weighted moving average gives more weight to the most recent data points than to older data points. This type of average is calculated by multiplying each data point by a weighting factor, and then summing the resulting values and dividing by the sum of the weighting factors.
The most commonly used moving averages in trading are the 50-day and the 200-day moving averages. When the short-term moving average (50-day) crosses above the long-term moving average (200-day), it is considered a bullish signal and traders may consider buying the asset. Conversely, when the short-term moving average crosses below the long-term moving average, it is considered a bearish signal and traders may consider selling the asset.
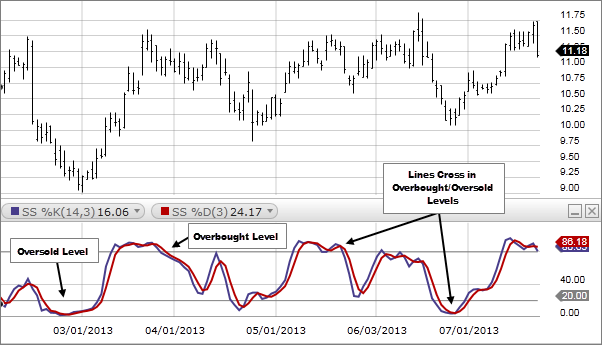
Moving averages can also be used in combination with other indicators such as RSI, Stochastic, etc. to confirm a signal or trend. As with any indicator, it’s important to use moving averages in context with other market information such as overall market trend, support and resistance levels, and other technical indicators to make informed decisions.


