How to Calculate Your Liquidation Price and Position Size: The Universal DN Calculator for 2026
How to Calculate Your Liquidation Price and Position Size — The Universal DN Calculator for 2026
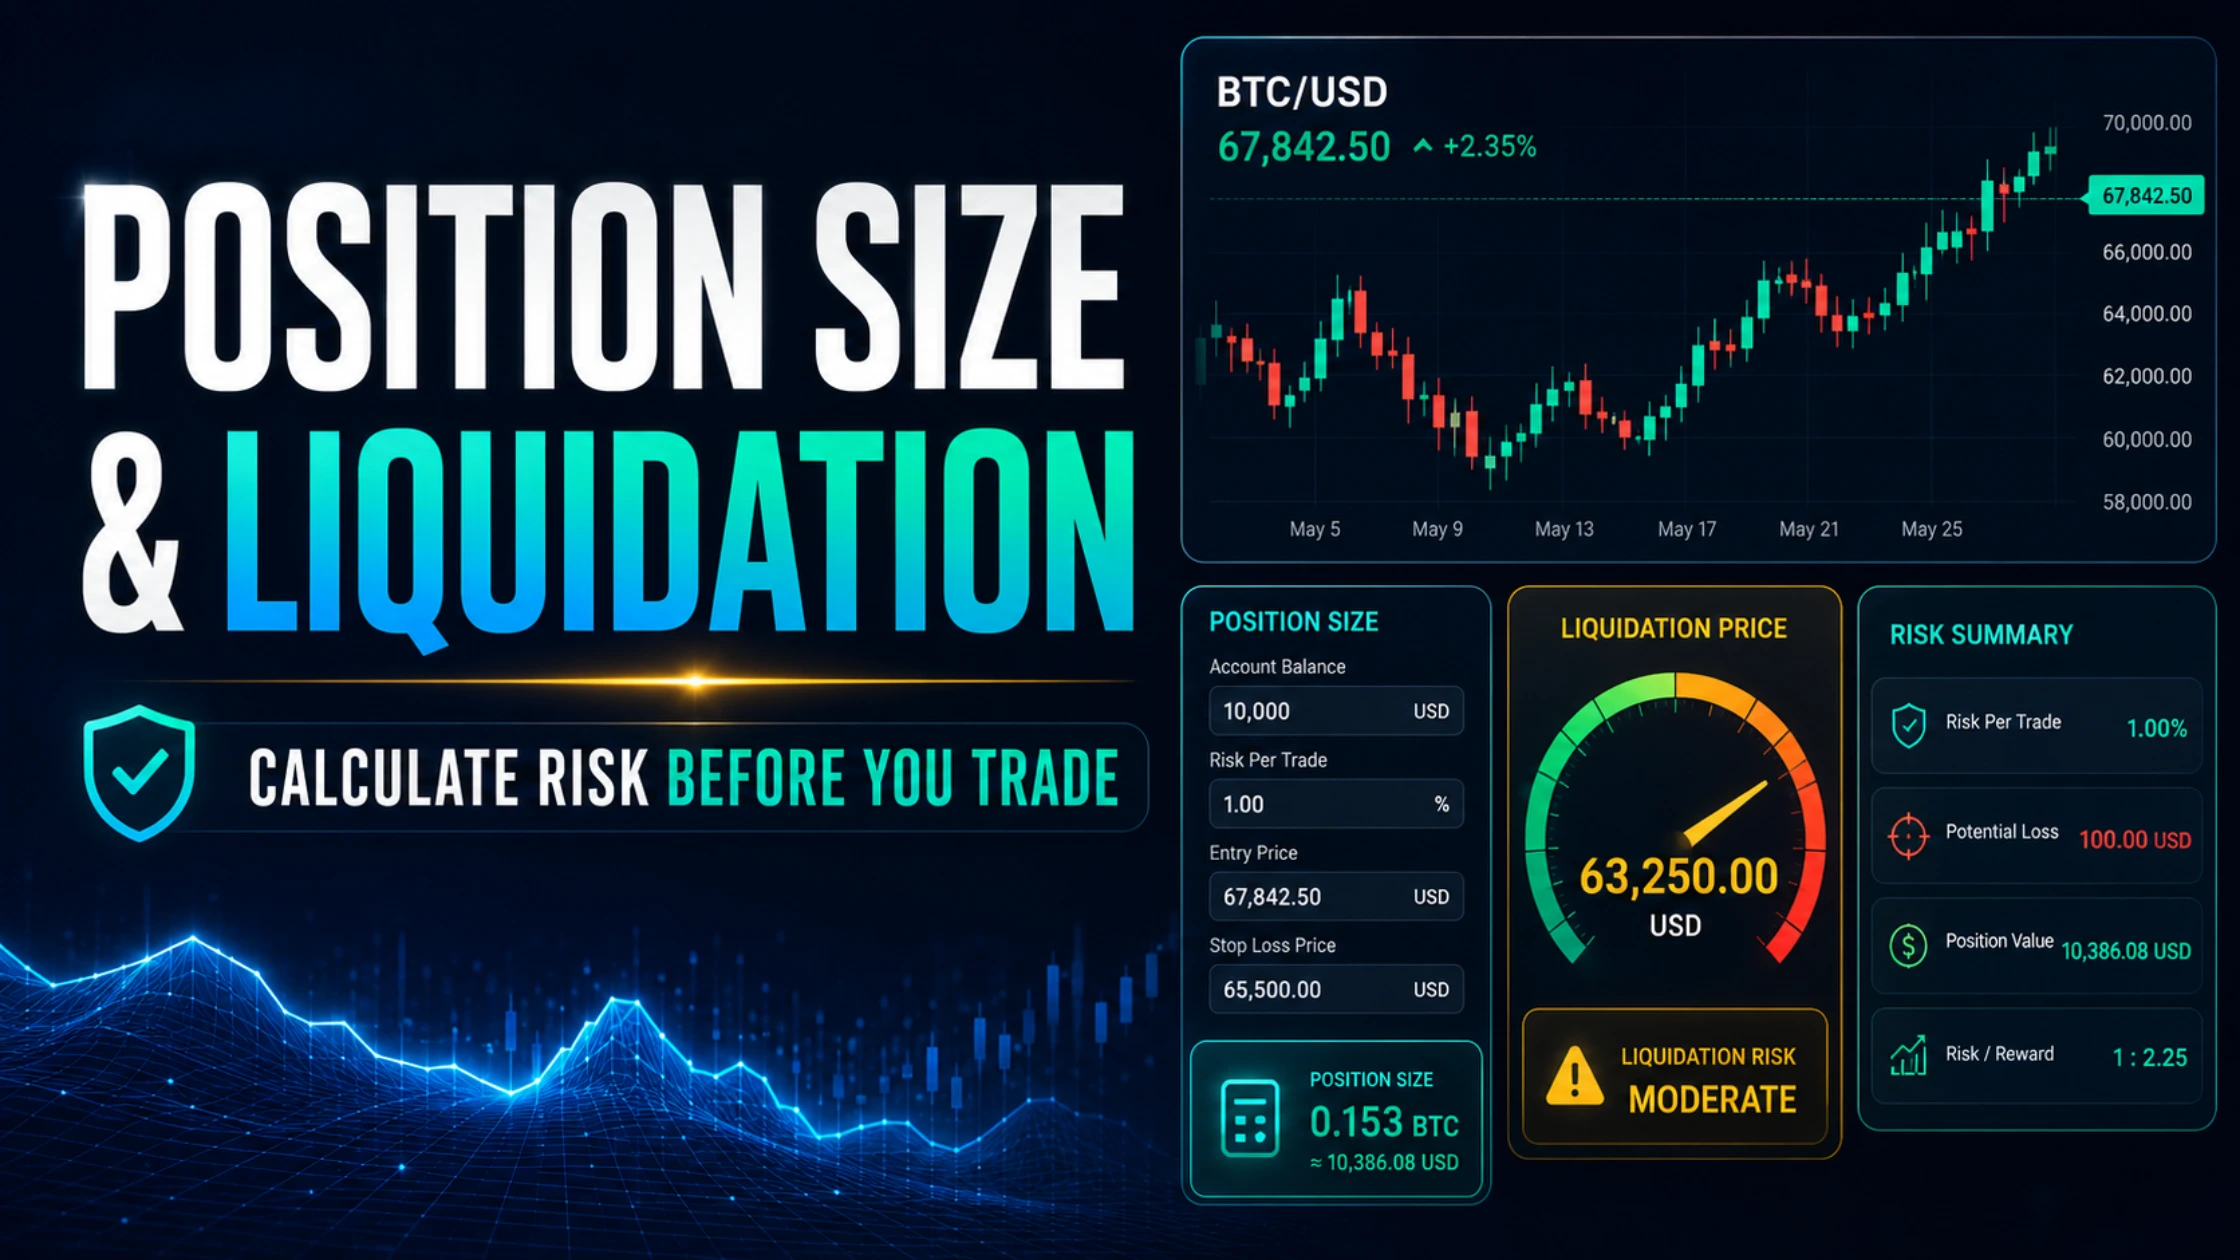
Pick your exchange, enter your trade, and see your exact liquidation price, position size and true dollar risk — with the fees and maintenance margin most calculators ignore.
Your liquidation price is the level at which an exchange force-closes your leveraged position. For a long it is roughly entry price × (1 − 1/leverage + maintenance margin rate); for a short, entry × (1 + 1/leverage − maintenance margin rate). Position size should be set from risk, not leverage: risk a fixed small percentage of your account per trade, then size the position so your stop-loss equals that amount. The calculator below does both precisely, accounts for each venue's fees and maintenance margin, and warns you when your liquidation sits inside your stop.
Almost every blown account in crypto dies the same way: the trader picks a leverage number first, sizes the position to whatever that leverage allows, and only discovers where their liquidation price sits when the candle is already wicking through it. They had the process exactly backwards. Professionals start from a single question — how much am I willing to lose on this trade — and let that answer determine everything else, including how much leverage they can responsibly use.
This calculator runs that professional process for you, and it does it with venue-level precision. Most online calculators quietly ignore two things that matter enormously: the maintenance margin rate, which differs by exchange and pushes your liquidation closer than the naive formula suggests, and the fees and funding that quietly erode your margin while you hold. Ours models both, per venue, for both isolated and cross margin.
Advanced — fees, funding & maintenance margin
—
Position sizing is the only edge that survives
You can be right about direction far more often than you are wrong and still go broke, because a single oversized loss erases a dozen disciplined wins. The reverse is also true: a trader with a mediocre win rate can compound steadily for years if every loss is small and pre-defined. This is the uncomfortable truth that separates traders who last from traders who blow up — your entries matter far less than how much you have on when you are wrong. Position sizing is not a chore you do after finding a trade. It is the edge.
The mechanism is simple arithmetic that becomes brutal at the extremes. Lose ten percent of your account and you need an eleven percent gain to recover. Lose fifty percent and you need a hundred percent gain just to break even. Lose ninety percent — one bad over-leveraged trade can do it — and you need a one thousand percent return to get back to where you started. Small, fixed losses keep you on the gentle part of that curve. That is the entire game.
How to use the calculator
Work top to bottom. First select your exchange — this loads that venue's maintenance margin and fee defaults, which feed directly into the liquidation maths. Choose your direction and margin mode. Enter your account size and the percentage of it you are willing to risk on this single trade. Then enter your intended entry and your stop-loss — the price at which your trade idea is proven wrong.
From those inputs the calculator derives the position size that makes your stop-loss cost exactly your chosen risk amount, and nothing more. It then shows your liquidation price at the leverage you have selected, the margin that position consumes, the fees, the funding drag over your expected hold, and a verdict. Slide the leverage up and down and watch the liquidation price move toward or away from your stop. The goal is always the same: liquidation must sit beyond your stop, never inside it.
How liquidation price is actually calculated
For a standard linear perpetual, liquidation happens when your losses consume your position margin down to the maintenance margin the exchange requires you to keep. That yields two clean formulas, which this tool uses:
Short liquidation = entry × (1 + 1/leverage − maintenance rate)
The leverage term sets the bulk of the distance — at ten times leverage your liquidation sits roughly ten percent away, at fifty times roughly two percent away. The maintenance margin rate then pulls that liquidation slightly closer to your entry, which is exactly the detail naive calculators drop. A half-percent maintenance rate does not sound like much until you are at high leverage, where it can mean the difference between surviving a wick and being the wick. This is why venue accuracy matters: a calculator that ignores maintenance margin will tell you that you are safe when you are not.
The 1% rule, and why it works
The most durable risk framework in trading is the simplest: never risk more than one percent of your account on a single trade. With one percent risk, you can be wrong twenty times in a row and still have eighty percent of your capital intact — enough to recover comfortably. The rule is not about any single trade; it is about guaranteeing you survive the inevitable losing streak that would otherwise end you. The calculator defaults to one percent for this reason. More aggressive traders use two percent; almost no professional risks more, regardless of how certain the setup feels.
Notice what the rule does to leverage. Once your risk and your stop distance are fixed, your position size is fixed too — and leverage becomes nothing more than a question of how much margin that position locks up. Leverage stops being a way to bet bigger and becomes a way to bet capital-efficiently. That reframing is the single most important mental shift a leveraged trader can make.
The trap: when your liquidation sits inside your stop
Here is the error the calculator is built to catch. Suppose you size a position correctly for one percent risk with a three percent stop, then crank leverage to forty times to "free up margin." At forty times, your liquidation now sits around two percent from entry — closer than your three percent stop. The market does not need to invalidate your idea to ruin you; it only needs to dip two percent, liquidate you, and then reverse to exactly where your stop would have kept you safe. You took the full loss and missed the recovery.
Whenever the tool detects this, it warns you and tells you the maximum leverage that keeps your liquidation safely beyond your stop. Respect that number. The whole point of a stop-loss is to be the thing that closes your trade — never let the exchange's liquidation engine get there first.
Isolated versus cross, and why venues differ
In isolated margin, only the margin you assign to a position can be lost; your liquidation price is fixed by that margin and the rest of your account is ringfenced. In cross margin, your entire account balance backs the position, which pushes the liquidation price much further away — but at the cost of putting your whole account on the line if it ever gets there. Isolated is the disciplined default for directional trades; cross has its uses for hedged or market-neutral books, but it is how single bad trades turn into total wipeouts. The calculator models both correctly so you can see the trade-off in real numbers.
Venues differ in the details that feed these formulas. Maintenance margin rates, fee schedules and the size tiers at which they step up are not standardised, which is why a position that is safe on one exchange can be marginally riskier on another. Selecting your venue above loads representative tier-one figures; for large positions, set your exact maintenance rate in the advanced panel, because it climbs as your size grows.
Where to set the trade
Once your size and liquidation are dialled in, execution quality matters — deep liquidity, reliable fills under volatility, granular order types and competitive maintenance tiers. These are the perpetual venues we use and rate, each pre-loaded in the calculator above:
What this calculator will not do for you
It gives you precise numbers, but numbers are not discipline. It cannot stop you moving a stop once price approaches it, cannot account for slippage on a thin order book during a cascade, and cannot model the exact fee buffer each exchange folds into its liquidation engine — which is why real liquidation can occur a touch earlier than the formula suggests. Treat every output as a close, conservative estimate, confirm against your exchange's own position preview before you commit, and remember that the best risk tool in the world is useless if you override it in the heat of a trade.
Frequently asked questions
How do I calculate my liquidation price?
For a standard linear perpetual, long liquidation price equals entry price × (1 − 1/leverage + maintenance margin rate), and short liquidation equals entry × (1 + 1/leverage − maintenance margin rate). The leverage term sets most of the distance and the maintenance rate pulls it slightly closer to entry. The calculator above computes it exactly for your chosen exchange and margin mode.
How should I size a leveraged position?
Size from risk, not leverage. Decide the percentage of your account you are willing to lose on the trade (commonly 1%), then size the position so the distance to your stop-loss equals exactly that amount. Your position notional is your risk amount divided by the percentage distance from entry to stop. Leverage then only determines how much margin the position locks up.
What is the 1% rule in trading?
The 1% rule means never risking more than 1% of your account balance on a single trade. It ensures that even a long losing streak leaves most of your capital intact, so you survive to keep trading. It is the most widely used risk-control rule among professional traders.
Why is my liquidation closer than the simple formula says?
Because the maintenance margin rate moves it closer to your entry, and exchanges also fold a small fee buffer into their liquidation engine. Calculators that ignore maintenance margin overstate your safety. This tool includes the per-venue maintenance rate, which is why its liquidation price is more conservative and more accurate.
What is the difference between isolated and cross margin?
In isolated margin, only the margin assigned to a position is at risk, and the liquidation price is fixed by that margin. In cross margin, your whole account backs the position, pushing liquidation much further away but risking the entire balance. Isolated is the safer default for directional trades.
Can my stop-loss protect me from liquidation?
Only if your liquidation price sits beyond your stop. If high leverage places liquidation closer to entry than your stop, the exchange can liquidate you before your stop triggers. Always set leverage low enough that liquidation is further from entry than your stop — the calculator flags this and shows the maximum safe leverage.
This tool and article are for educational and informational purposes only and do not constitute financial, investment or trading advice. Leveraged derivatives trading is extremely high risk and can result in the rapid and total loss of capital. All calculations are estimates that exclude exchange-specific fee buffers and assume tier-one maintenance margin; always verify against your exchange before trading. Never trade with money you cannot afford to lose, and consider consulting a licensed financial professional. Decentralised News may earn a commission from exchanges linked in this article at no additional cost to you.